Education
April 30, 2021

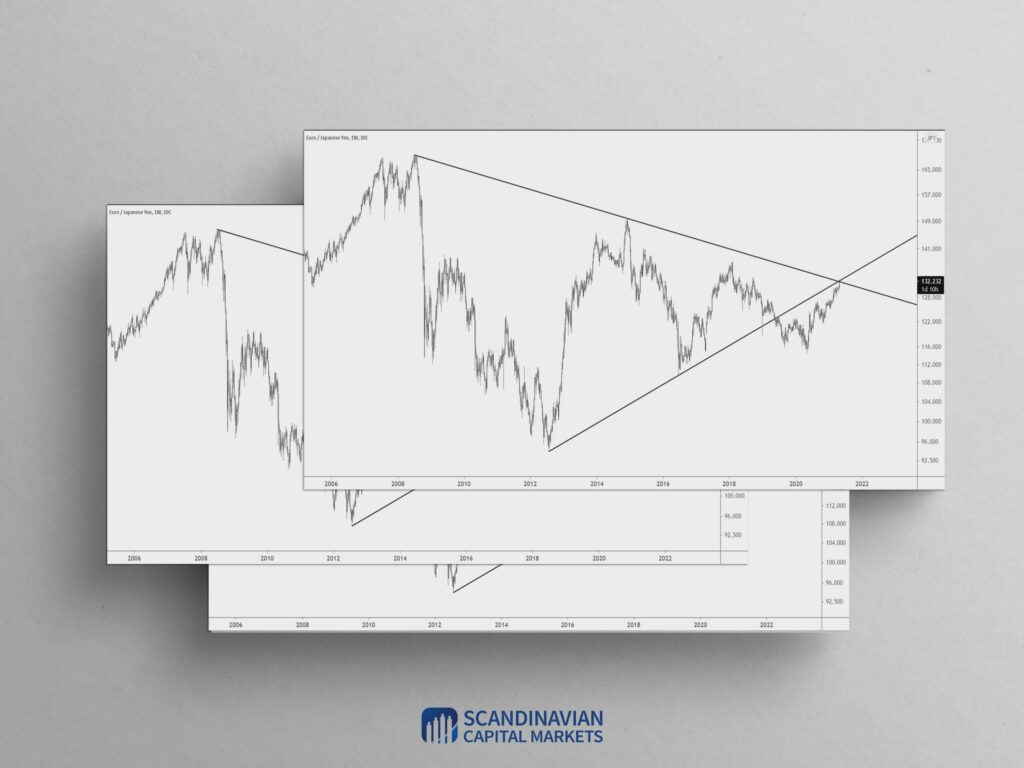
EURJPY closed right at 132.00 today. This is HUGE. The level is defined by the underside of the trendline from the 2012 low and the trendline from the 2008 high! If you look at a 4 hour chart, you’ll see a 4 hour reversal candle. This occurred during the active U.S. session so perhaps a top is in place? The big short trigger remains a break of the upward sloping trendline but if price drops in a clear 5 waves from today’s high then I’ll plot an entry. Stay tuned.
April 29, 2021

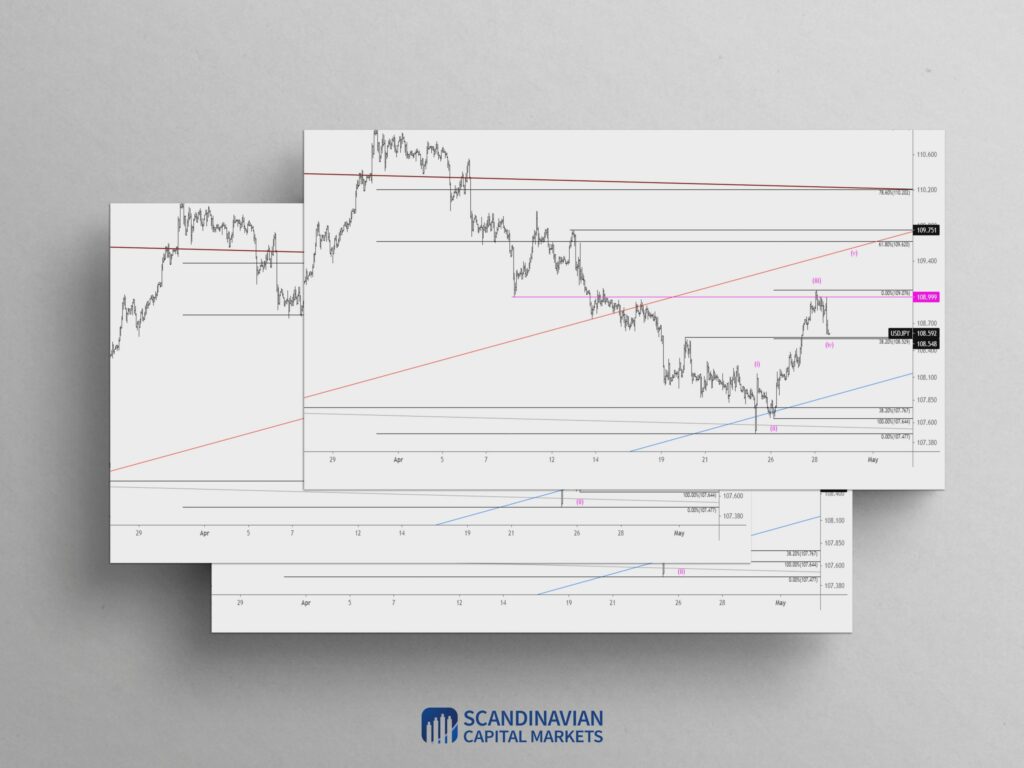
USDJPY did indeed pull back from 109.00. My near term view is that the drop is a 4th wave within a 5 wave rally from the 4/23 low. Ideal is support is 108.52/55. This is the 38.2% retrace of proposed wave 3 and the 4/20 high.
April 28, 2021
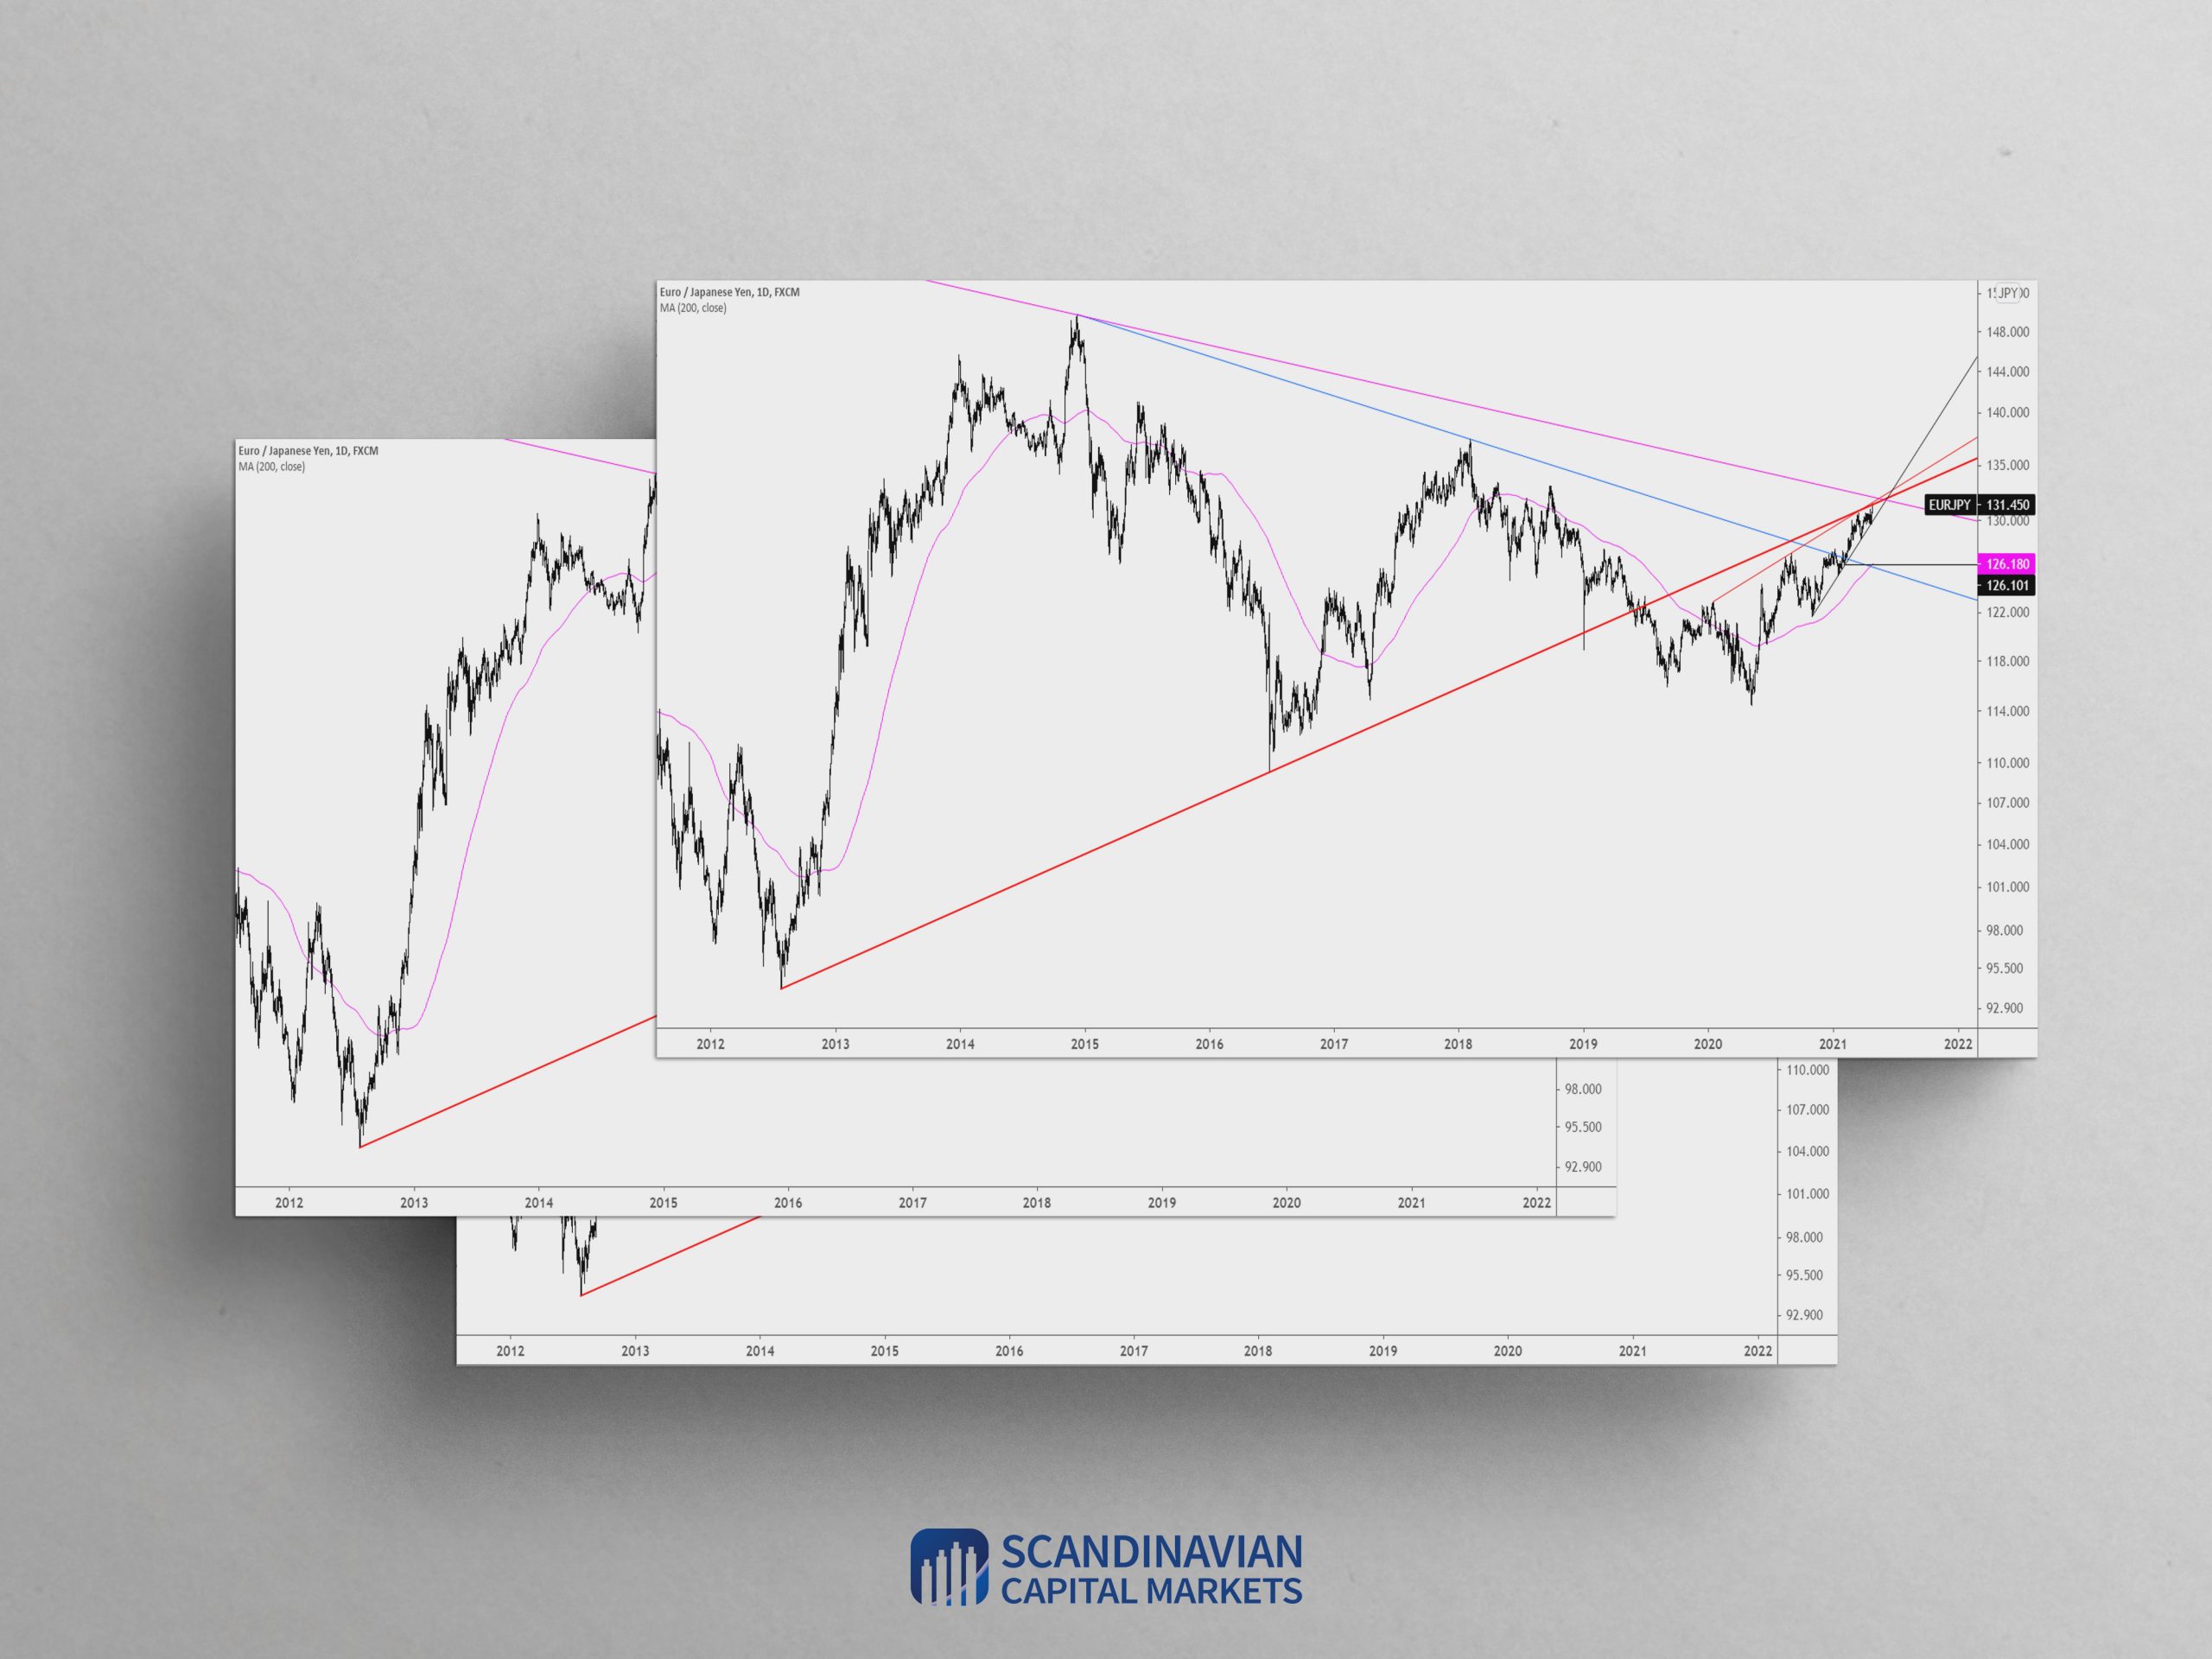
EURJPY has reached the underside of the line off of the 2012 and 2016 lows. This is also the line that extends off of highs since January 2020. The line off of the 2008 and 2014 highs (magenta line) is just above the market…at about 132.00. 131.89 is also where the rally from the May low would equal 61.8% of the 2016-2018 rally. This is interesting because action since the 2014 high may be a triangle and alternate legs within triangles often relate by 61.8%. Bottom line, now to 132.00 is a zone for a top.
April 21, 2021

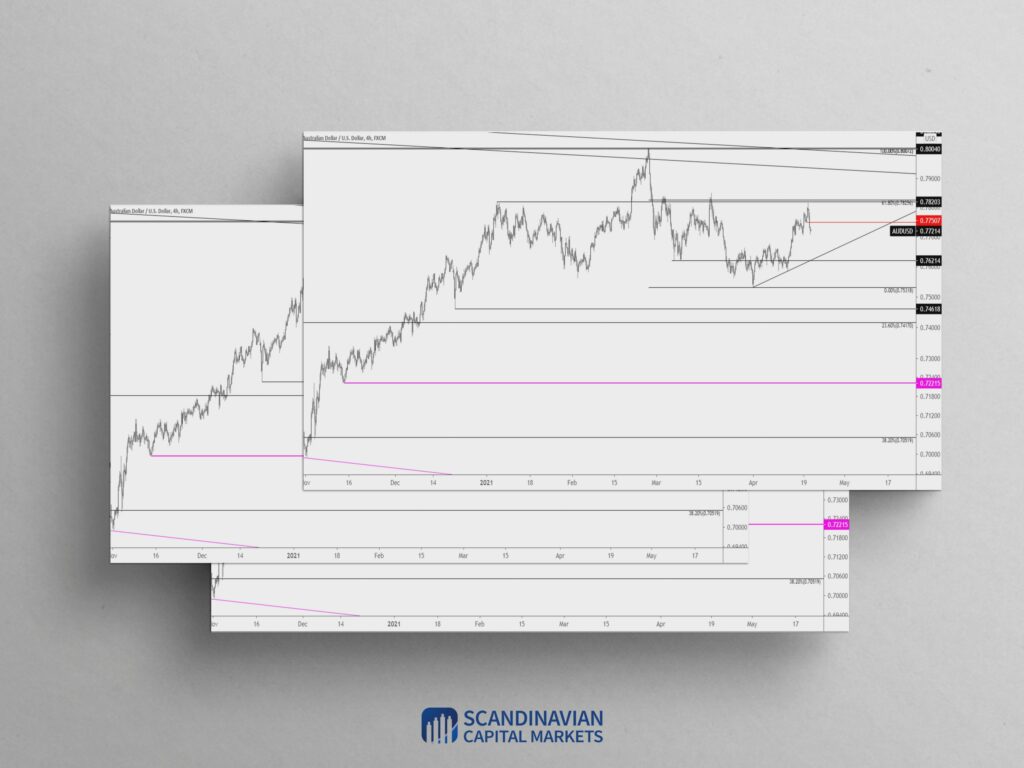
AUDUSD reversed sharply lower today after coming within pips of the 61.8% retrace of the drop from the February high and early January high. Near term downside focus is .7620. Proposed resistance is .7750.
April 20, 2021

The sharp USD drop on Monday makes me neutral at best for now. I had wanted to see USDOLLAR hold the median line from the multiyear structure in order to stay constructive (see below). That said, DXY has reached VWAP from the January low and USDOLLAR has reached the 3/18 low. The 61.8% retrace for USDOLLAR is slightly lower at 11705. Keep an eye on these levels for possible support.
March 25, 2021
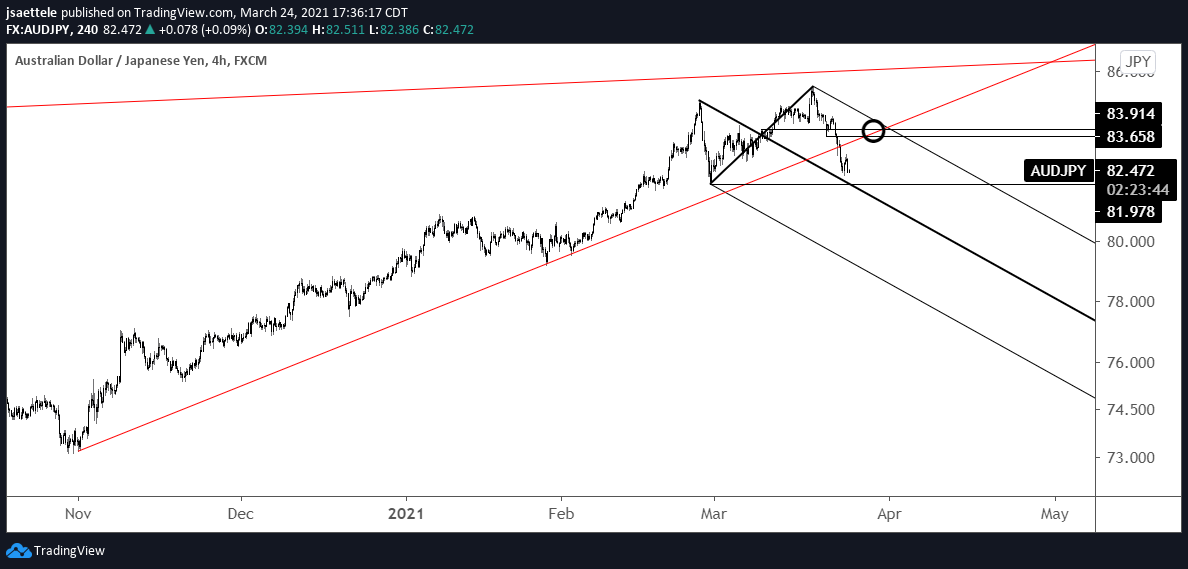
I love this AUDJPY short setup. Price has broken below the trendline from the November low. The underside of that line is now proposed resistance at 83.65/90. The 2/26 low is a bounce level at 81.98. Downside is the lower parallel from the bearish fork, which is significant (probably a 78 handle).
March 24, 2021

The break above the median line in USDOLLAR is significant! The top side of this line should provide support now near 11810. The September low at 11867 is possible resistance for a pullback/pause but general focus is on the parallel that was resistance in Q4 2020 (then reassess). That line is about 12030. The long term view is shown below for context.
March 23, 2021

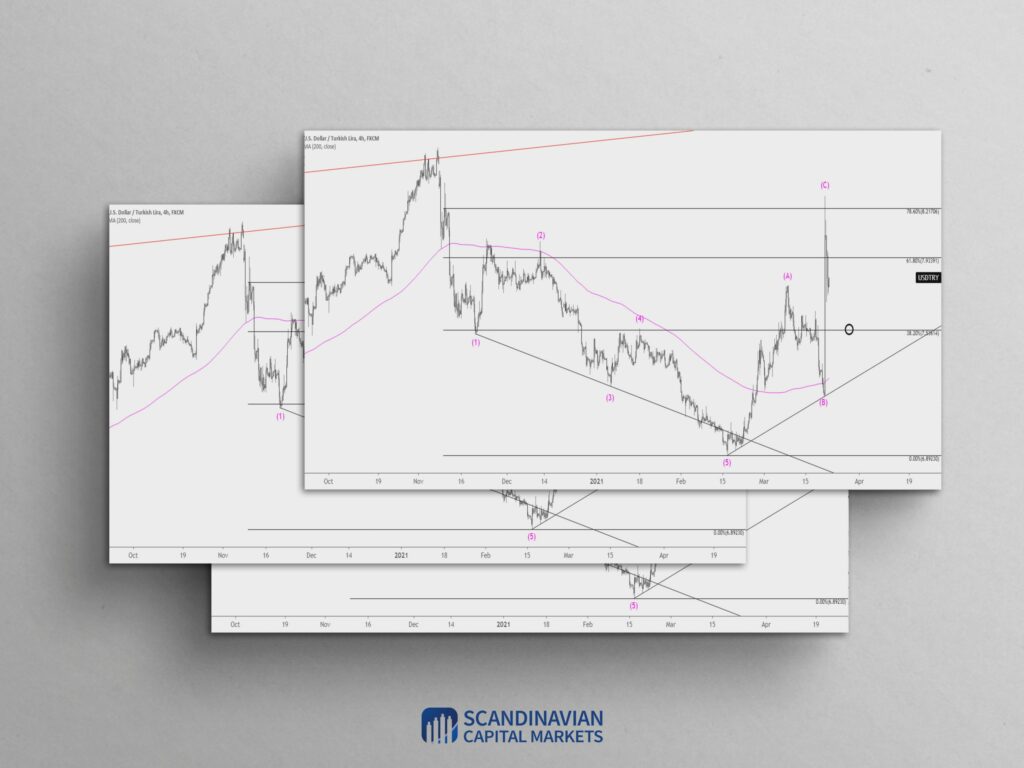
USDTRY swings remains TEXTBOOK. The massive gap higher after the weekend is wave C of the noted A-B-C advance from the February low. In fact, the high is at the 78.6% retrace of the decline from the November high. Recall that when the leading diagonal was first identified after the February low, I noted that corrections after leading diagonals tend to retrace 78.6% of the diagonal. Voila! I am bearish again and resistance is 7.9990-8.0595. Don’t forget that USDTRY remains below long term resistance