Market Update 4/28 – Short Term USDJPY Idea

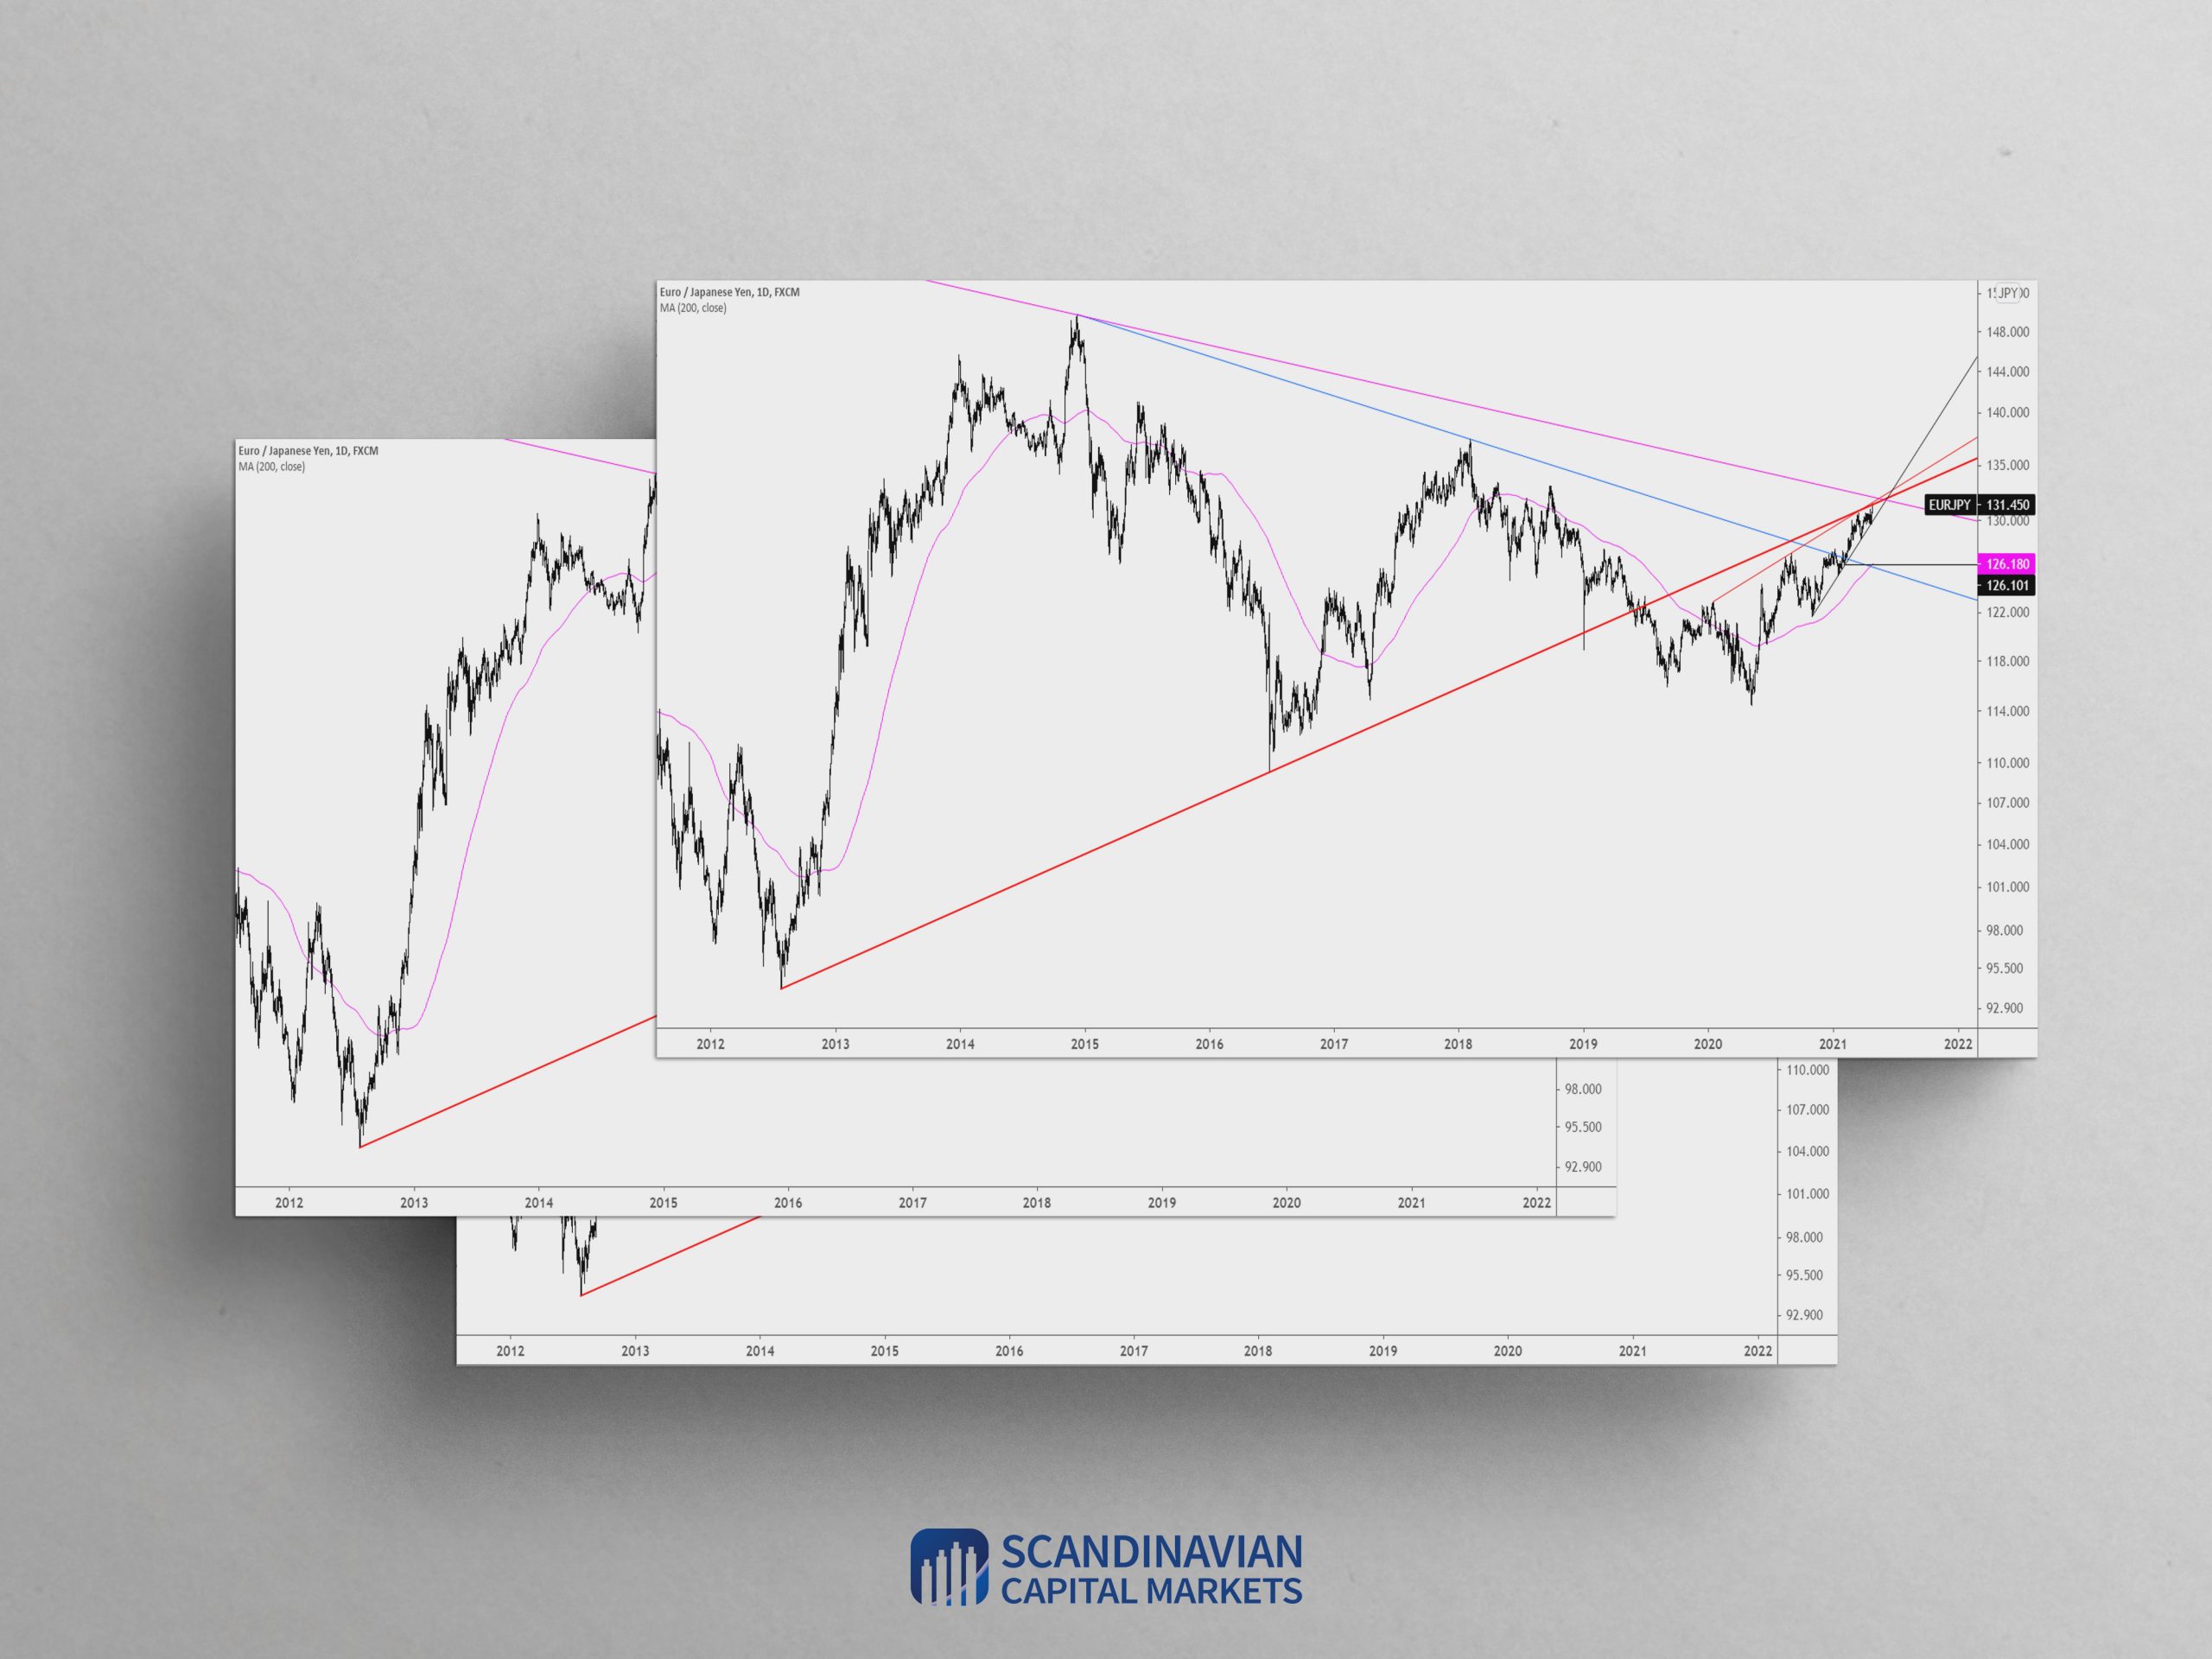
Market Update 4/27 – EURJPY at Important Zone
April 28, 2021
Market Update 4/29 – EURJPY Top?
April 30, 2021

Minimal Clean Multiple Landing Page Website Psd Mockup
DXY DAILY

DXY continues to sink. Pay attention to the line drawn off of the January and February lows. That line is about 90.30. Also, if we employ the concept of ‘original slope’, then the lower channel line comes in near the same level (see 4 hour chart below).
DXY 4 HOUR

BTCUSD 4 HOUR

The BTCUSD drop extended into 5 waves so my view is that this rally is corrective. Specifically, wave A of an A-B-C rally may be complete so allow for a B wave drop and then a final rally in wave C in order to complete the sequence. Levels to know are 50600 and 58000.
4/18 – BTCUSD is trading at the same level as it was 2 months ago and everything since that time has the look of an ending diagonal. Price also broke a short term trendline over the weekend (see chart below). Is this about to come apart? Pay attention to the 20 week average, which tends to provide support during bull trends. That average is currently near 44000.
NZDUSD 4 HOUR

NZDUSD is into the noted level for a possible top (wave 5 takes the form of an ending diagonal). The upper channel line is about .7280. I’m on alert for a reversal and if such evidence arises then I’ll plot a short entry and target the line that crosses the April lows. That line intersects the 4th wave low at .7122 on 5/5.
4/26 – The Kiwi rally has also extended into 5 waves. .7265 is ‘perfect’ for a top. The level is defined by the 61.8% retrace of the decline from the 2/25 high, the 3/18 high, and parallel resistance. Keep .7100 in mind for eventual support.
USDCAD WEEKLY

USDCAD is approaching a HUGE level. The level includes the 2018 low at 1.2247, center line of the original channel from the 2011 low (this line was precise support in June 2014), and the median line of the structure that originates at the 2016 high.
USDJPY HOURLY

USDJPY did indeed pull back from 109.00. My near term view is that the drop is a 4th wave within a 5 wave rally from the 4/23 low. Ideal is support is 108.52/55. This is the 38.2% retrace of proposed wave 3 and the 4/20 high.
4/27 – Today was extremely quiet but Yen crosses popped. 109.60/75 remains proposed resistance but pay attention to 109.00 as well. 109.00 is the equivalent level for VWAP from the 3/31 Yen low in futures (3/31 USDJPY high). The futures chart is below. Watch 108.20s for support now. I maintain that the big move is lower in USDJPY and that the rally from last week’s low will prove corrective. Don’t forget that seasonal tendencies are negative through mid-October.
USDCHF DAILY

USDCHF is into channel support from the January low. The 200 day average is also here and the level was resistance in late November and late February. I’m looking for a turn higher.


