Education
May 24, 2022
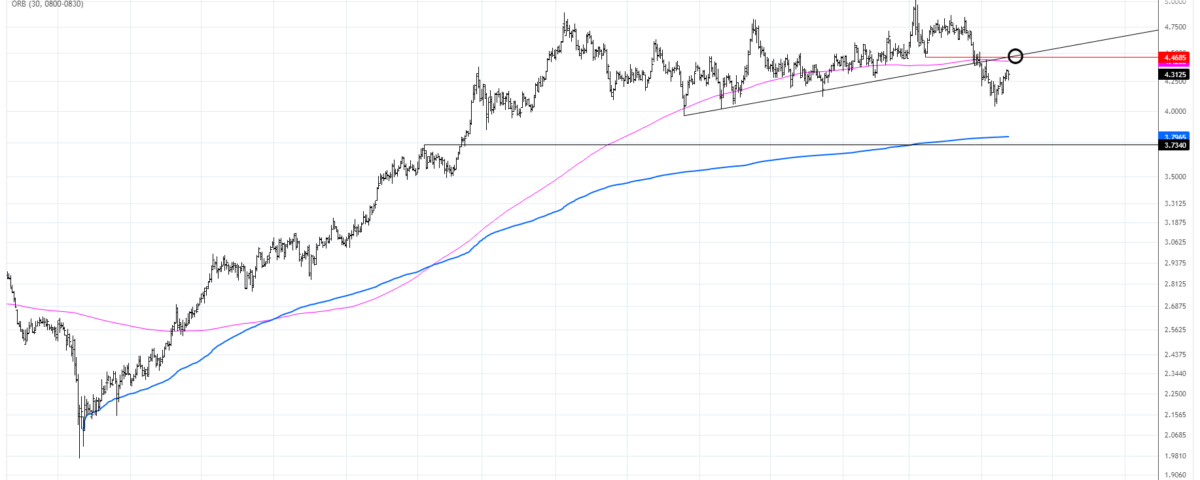
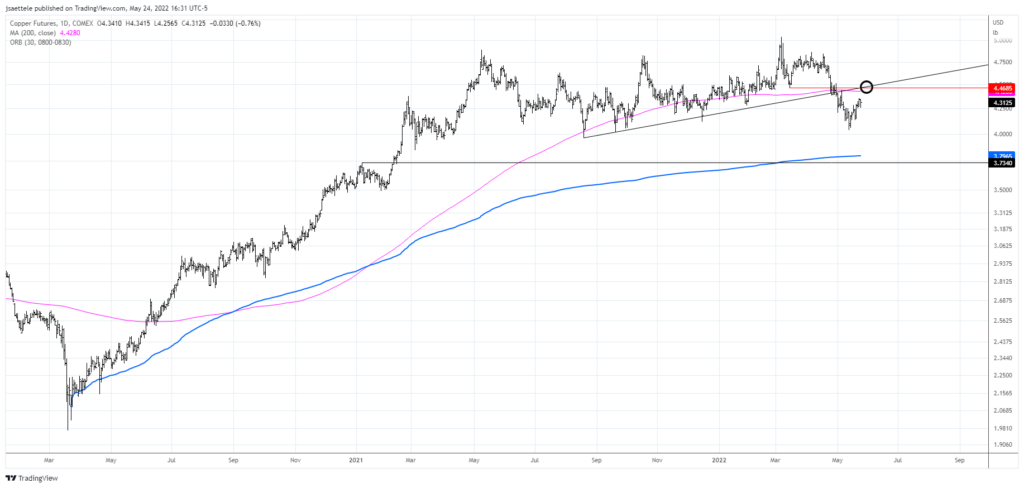
Copper has rebounded after testing a support shelf from last fall. 4.46 or so is well-defined for resistance. The level is defined by the 200 day average, the underside of former trendline support, and the March low.
May 23, 2022
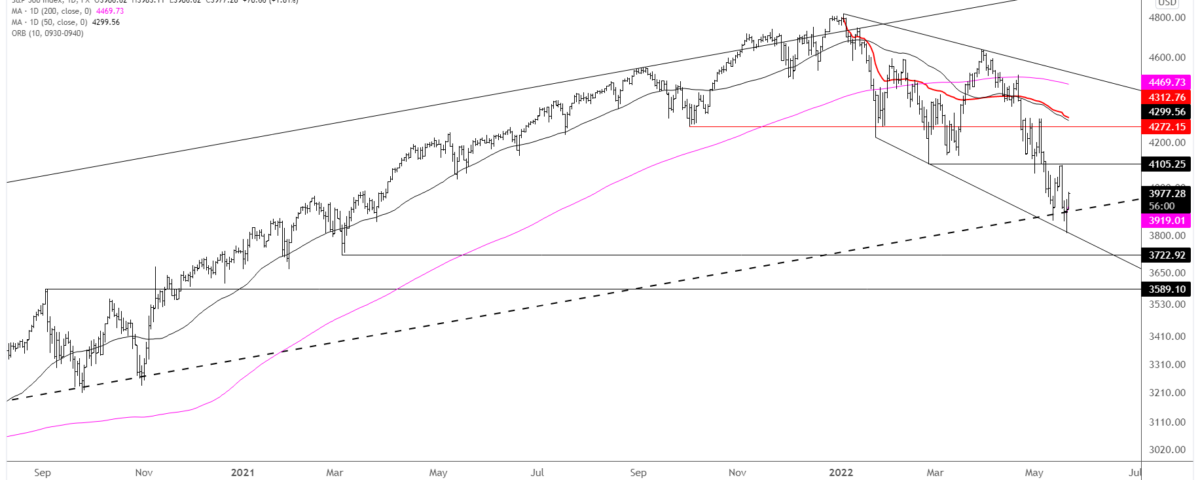
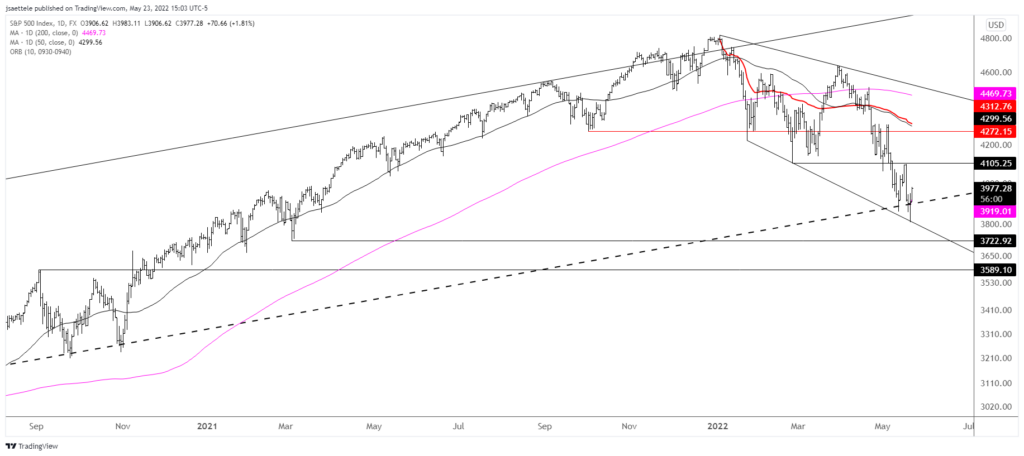
As noted, evidence for a low in the S&P is strong. Friday’s low is at the line that crosses the January and February lows and the LONG TERM parallel (see below chart). Also, VWAP from the 2020 low in SPY held last week (see 2 charts down). 4105 is the initial level to pay attention to but 4270s in the index and 426.00s in SPY line up more significant levels…eventually.
May 19, 2022
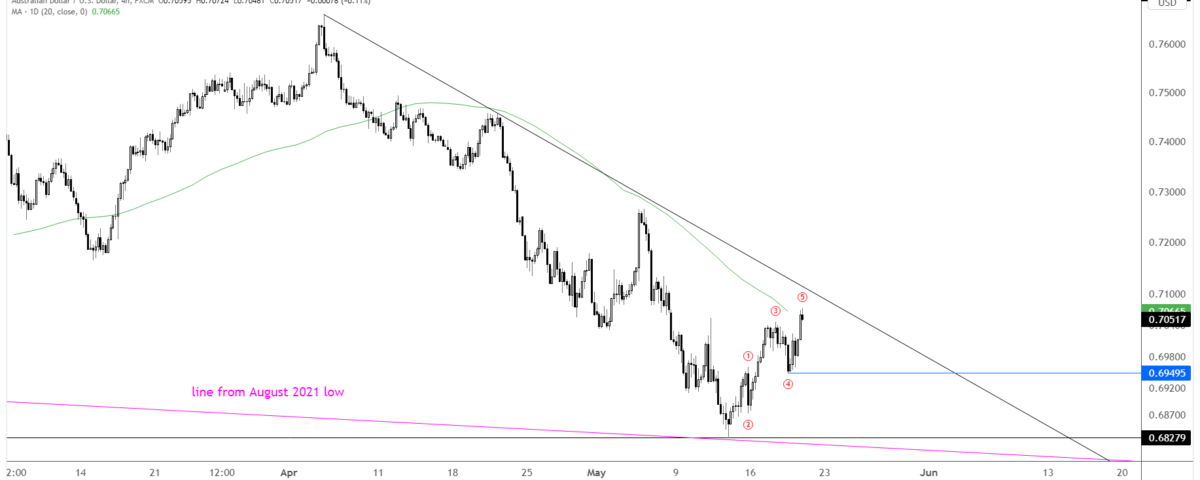
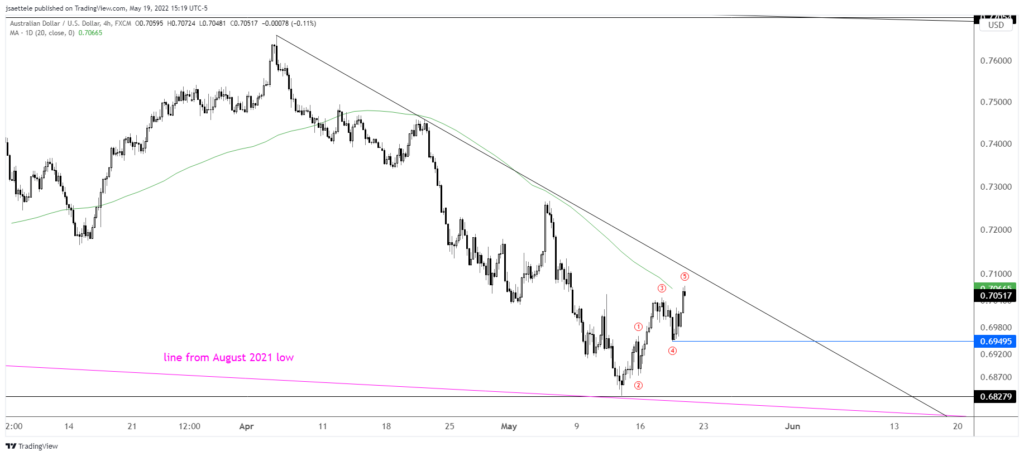
AUDUSD has turned up sharply from the line that crosses lows since August 2021. Also, .6828 is the January 2019 low (flash crash low). Price has reached the 20 day average and the line off of the April highs is just above the market. The rally appears in 5 waves too which raises risk of a pullback. Proposed support is the former 4th wave of one less degree at .6950.
May 18, 2022

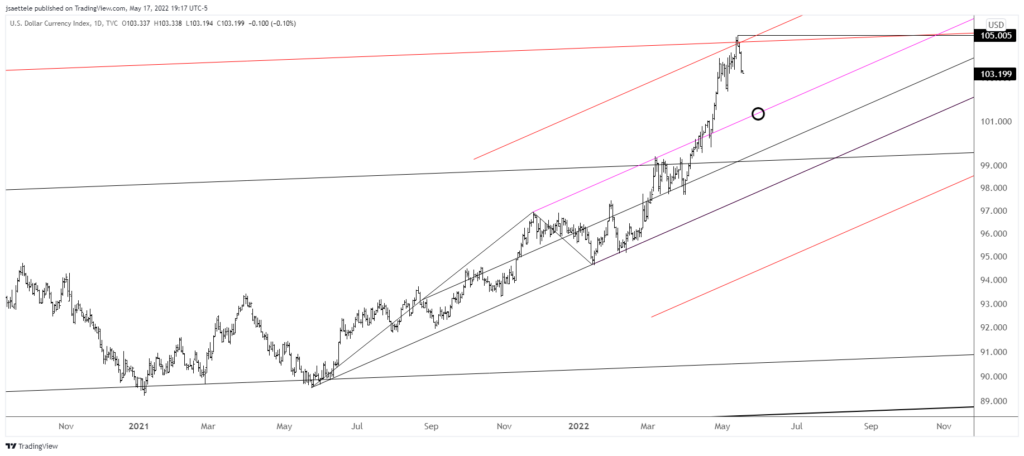
DXY topped RIGHT at the parallel that has been highlighted for weeks. Also, the full extension of the channel from the May 2021 low is on the high. The upper parallel (magenta line) from that channel is now proposed support near 101.20/30 over the next week. 103.90-104.20 is proposed support.
May 17, 2022

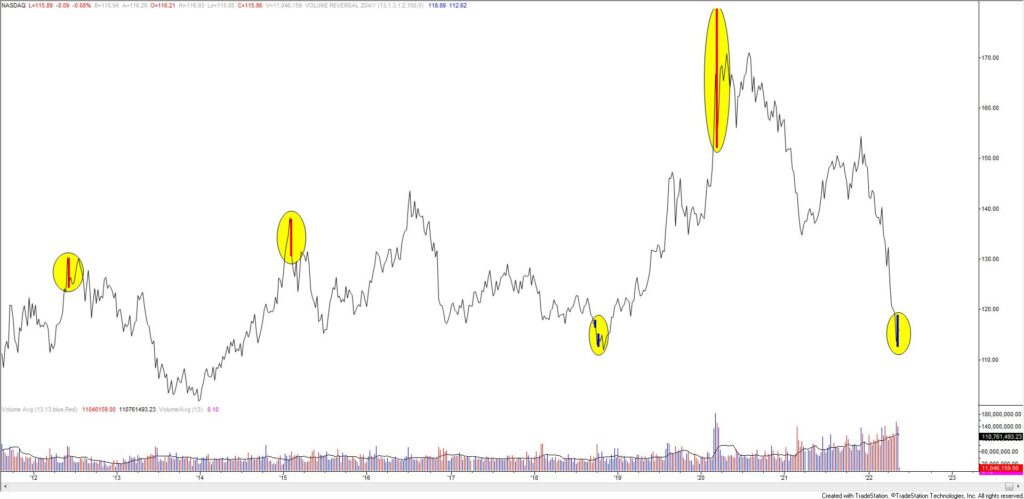
TLT completed a 2 week high volume reversal last week. Over the last 10 years, this signal has occurred right at or very close to a major turn. Also, a 1 week volume reversal triggered last week (see below). This is just the second 1 week bullish reversal since the inception of the ETF. The other one marked the 2007 low.
May 12, 2022
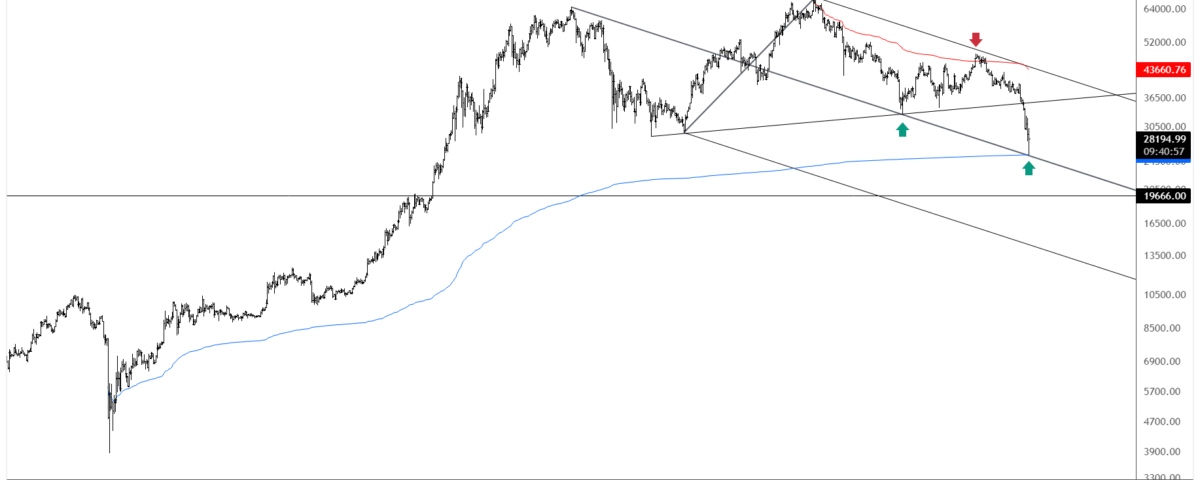
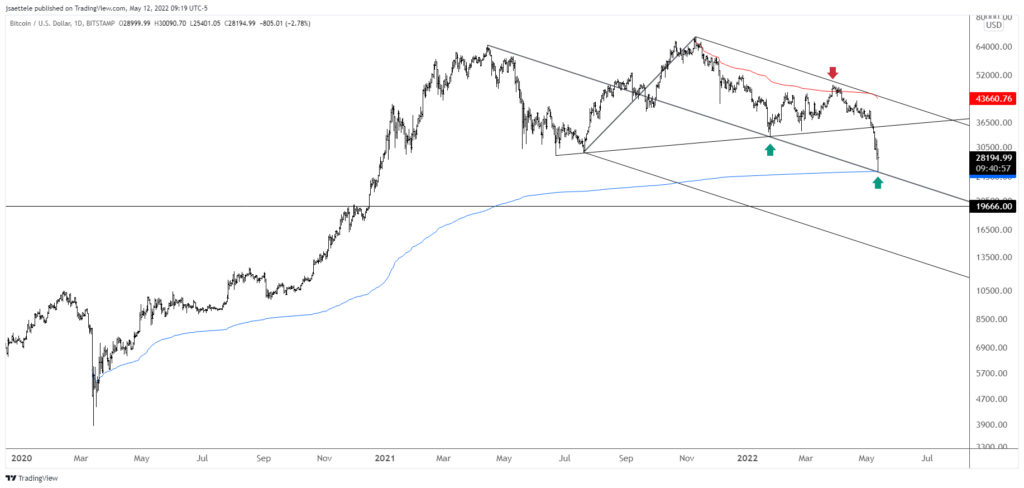
BTCUSD reversed off of the VWAP and the median line today! This is huge and sets a line in the sand for BTCUSD and probably crypto and ‘risk’ in general (see the Nasdaq composite and BTCUSD overlay below). IF a screaming rally is going to unfold then it’s from this level. The former low at 32950 is now resistance. Here’s the thing though…IF BTCUSD breaks below today’s low then we’re in crash territory until the lower parallel near 14000.
May 12, 2022
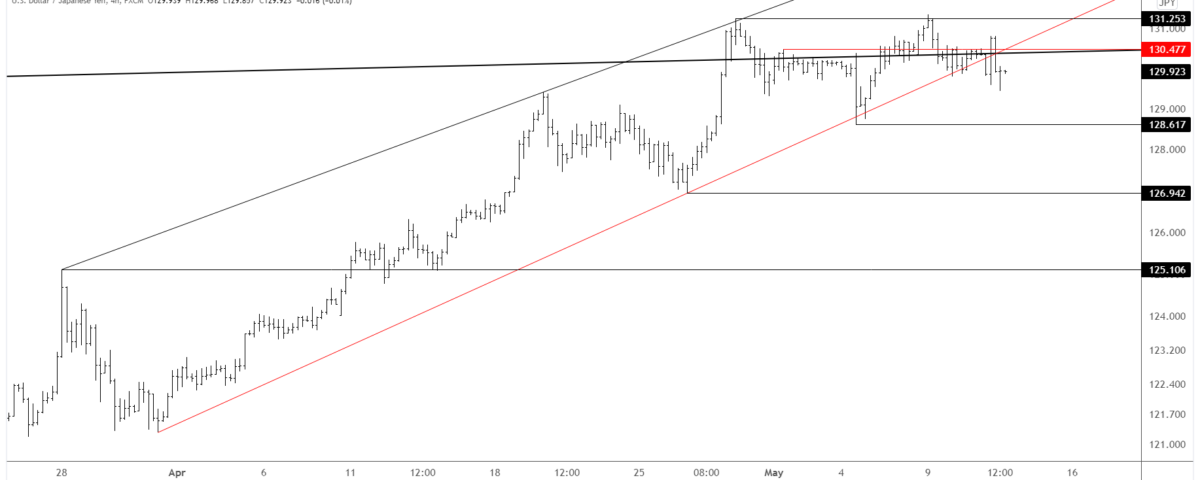
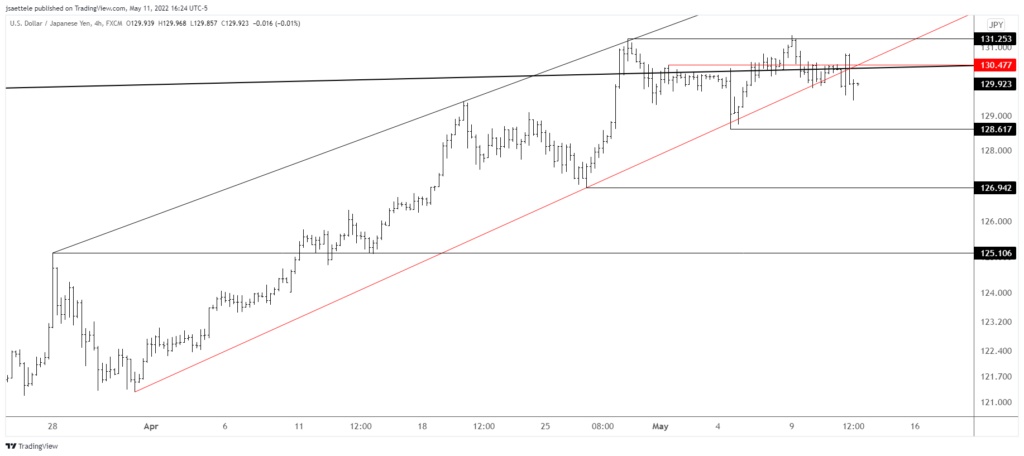
USDJPY has broken the trendline from the late March low. I’m bearish. 130.40/50 is now proposed resistance.
May 10, 2022
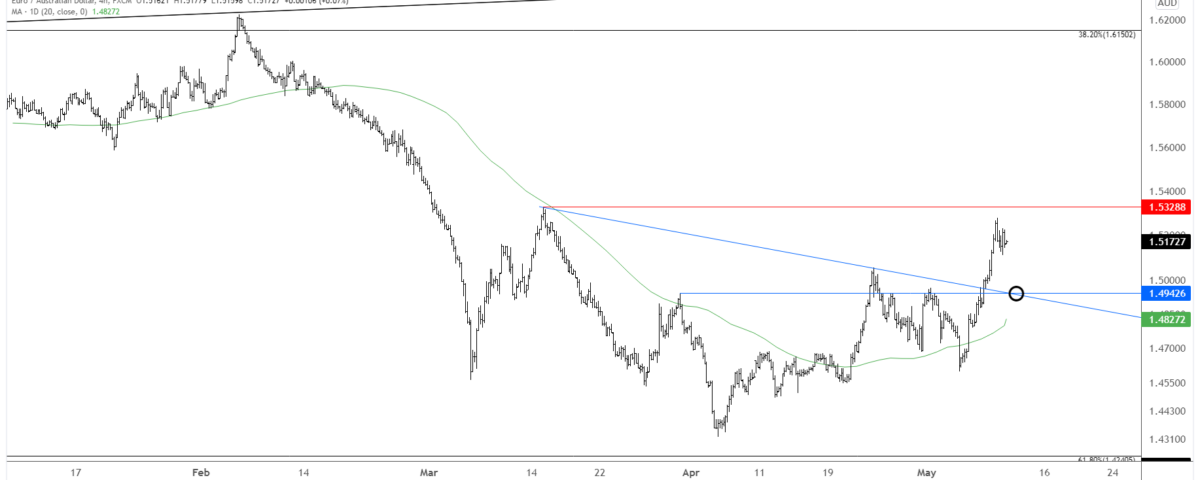
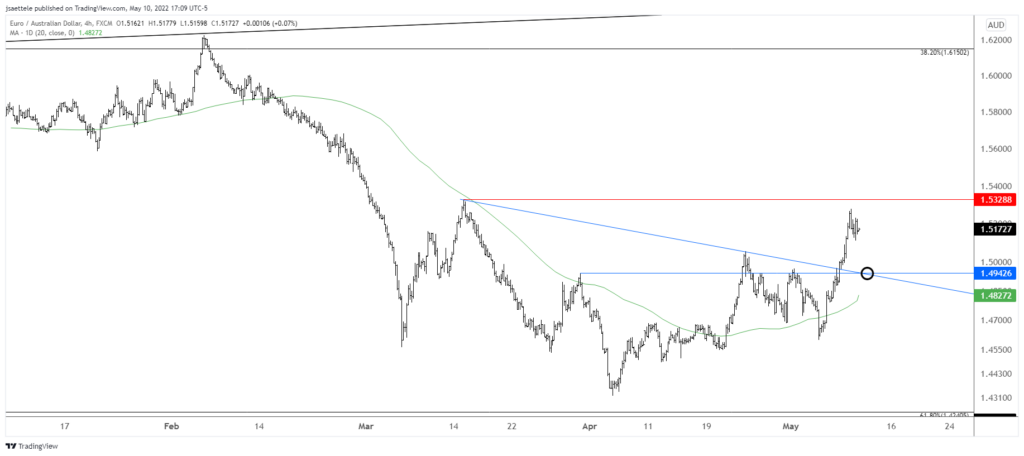
EURAUD sports a 2 month bottoming pattern (similar to the 2 month topping process in AUDJPY). Price is nearing the 3/15 high at 1.5329 which could produce a reaction lower. ‘Ideal’ support for a long entry is 1.4940s, which includes former resistance and the top side of the line off of the 3/15 and 4/25 highs.
May 9, 2022
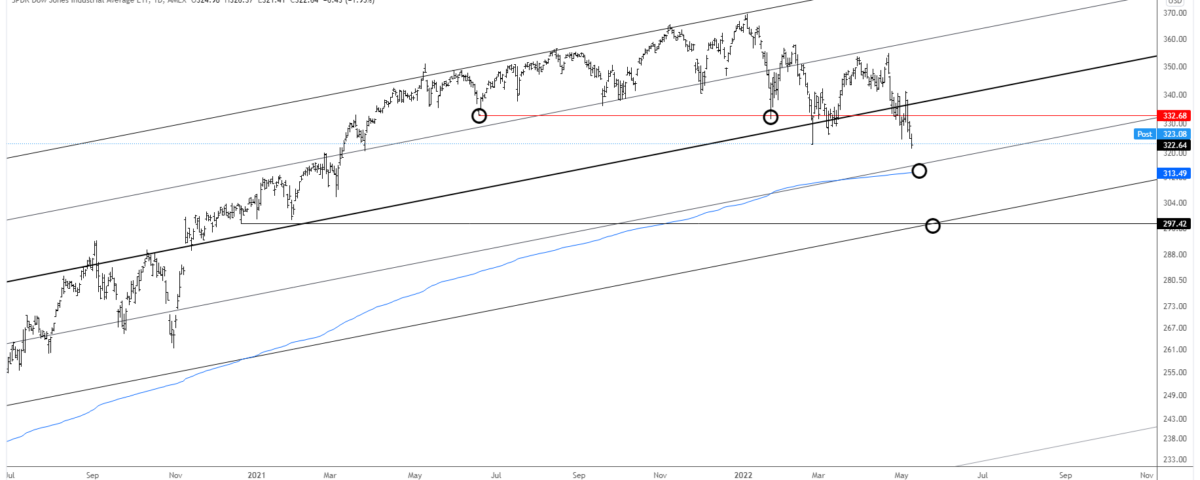
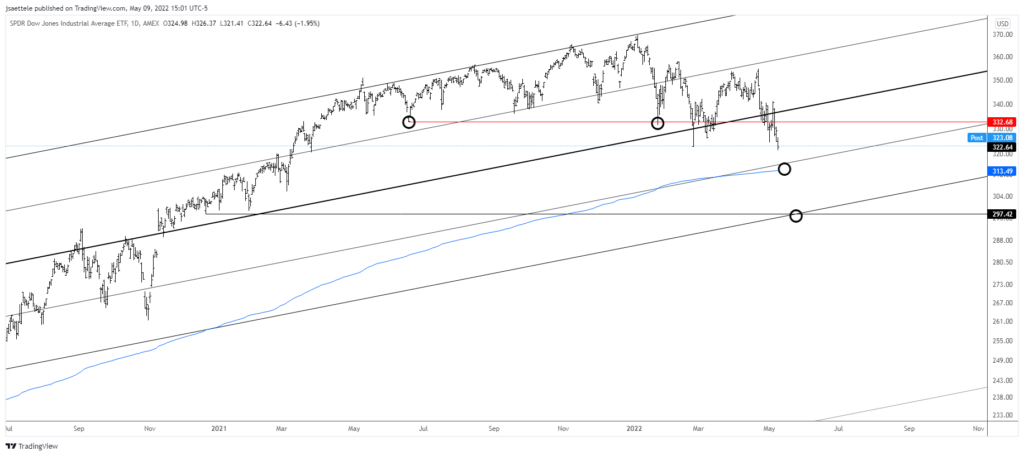
DIA (Dow ETF) levels are extremely well-defined. A massive top is completed and the biggest level on this chart is 297.50 (or so). A drop to that level would represent a 20% drop from the all-time high. In the grand scheme of things, that’s fairly normal. Possible trading levels before then include 313.50 (VWAP from the March 2020 low) and 332.70 for resistance (former support). The full view of the structure from the 2020 low is shown below.