Market Update 5/10 – Tracking EUR / Commodity FX Setups
SPOT SILVER DAILY
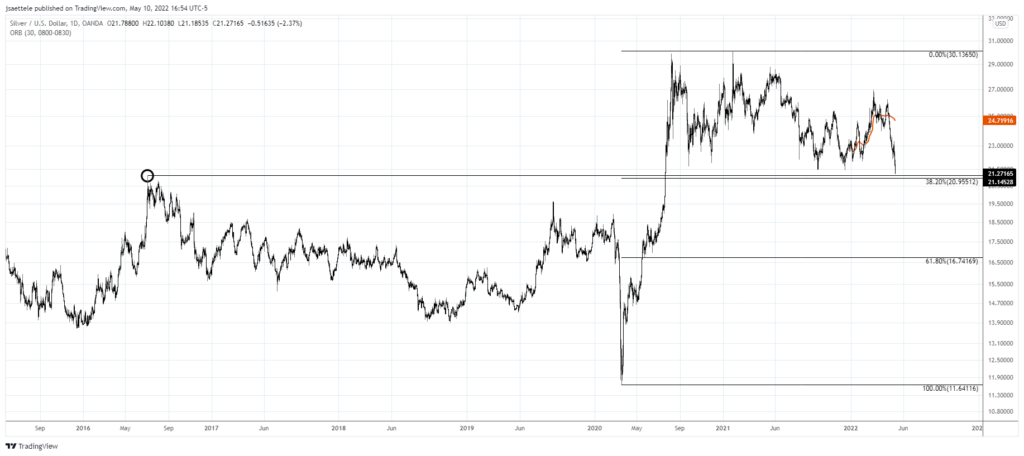
Silver just dropped to its lowest since July 2020. Apparently silver didn’t get the inflation memo. Anyway, price is ticks from the 2016 high at 21.15. The 38.2% retrace of the rally from March 2020 is 20.96. Watch the zone for support.
Do you make a profit trading Silver?
Try our funded trader program and get up to $1,000,000 in funding.
Learn more
SPOT GOLD DAILY
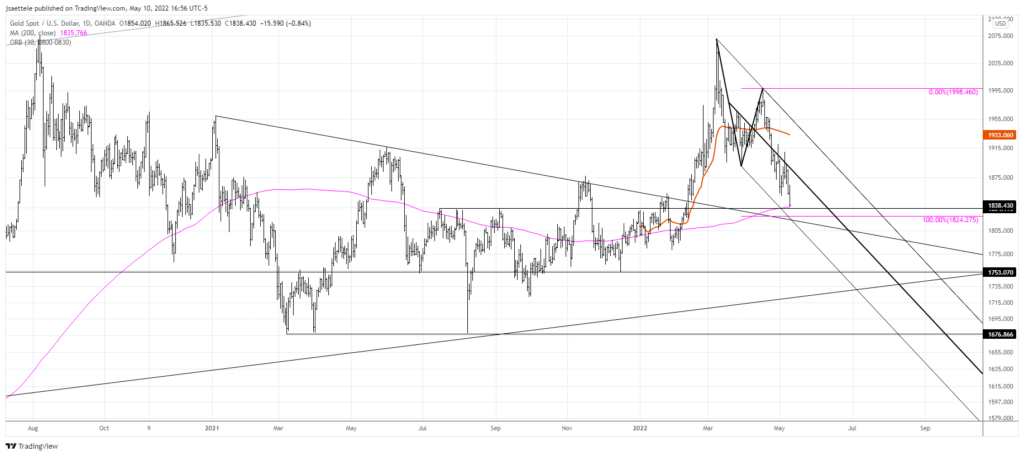
Notably, gold has NOT joined silver at range lows. In fact, gold is nowhere near its 2021 lows. As such, there is a massive divergence in place between gold and silver that tends to occur at important turning points. Gold specifically is near the top of the cited support zone (1824/35). The bottom of the zone is also corrective channel support. I’m on the lookout for a reversal higher.
5/9 – Pay attention to gold as it’s closing in on the key 1824/35 zone, which could produce a big low.
USDCHF DAILY
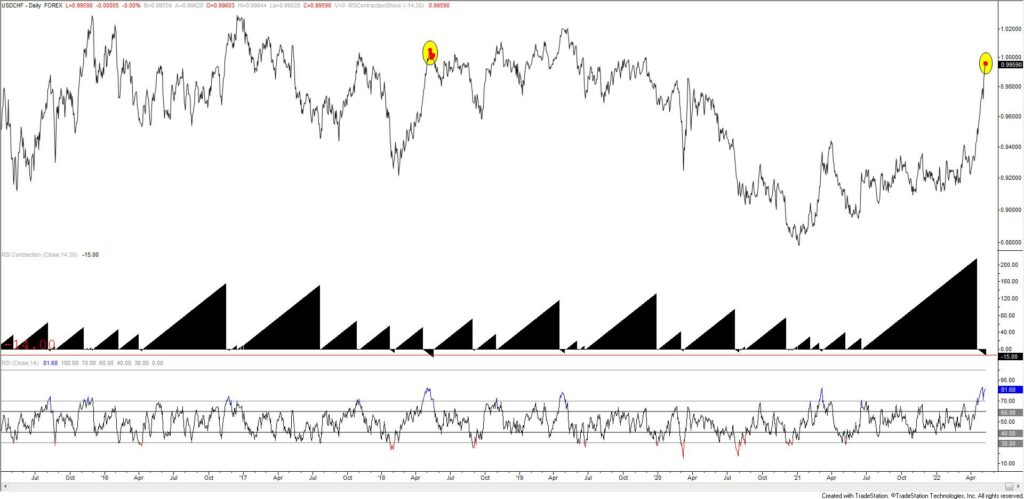
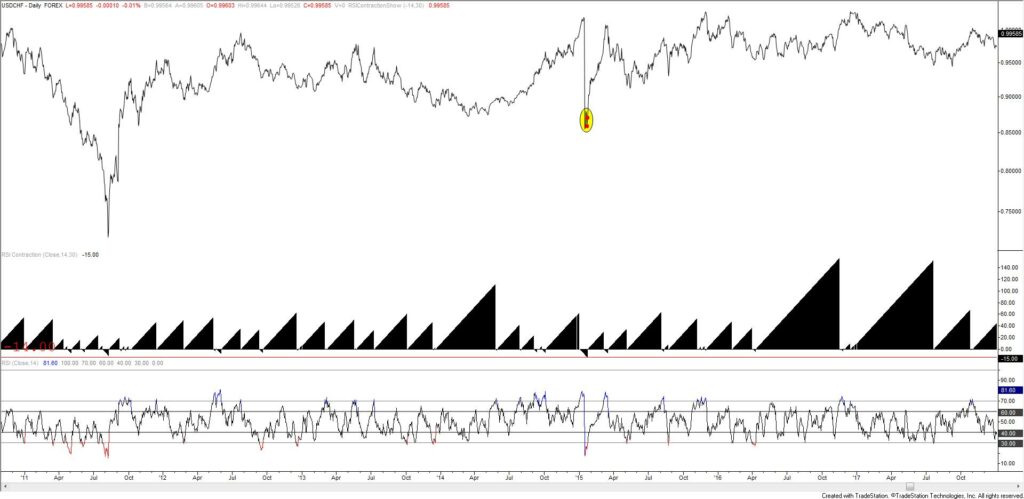
The strange looking indicator below price is the number of days that RSI has been either between 30 and 70 (a positive result) or the number of days that RSI has been below 30 OR above 70 (a negative result). The current reading for USDCHF is -14, meaning that RSI has been above 70 for 14 consecutive days. Previous instances of a reading this high resulted in reversals (see below as well).
USDCHF DAILY
USDCNH DAILY
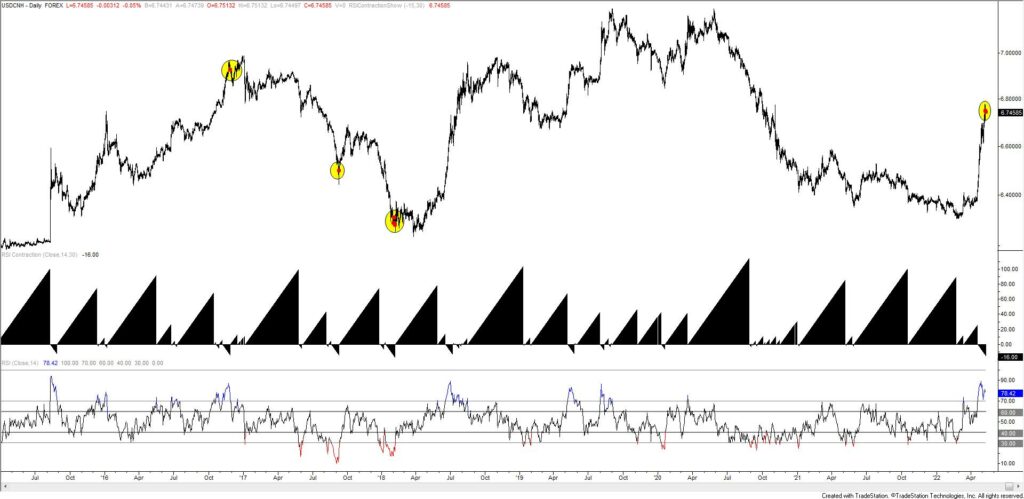
The same indicator is shown for USDCNH. The current reading is -15. Previous readings indicated either a reversal or the beginning of a turning process.
EURAUD 4 HOUR
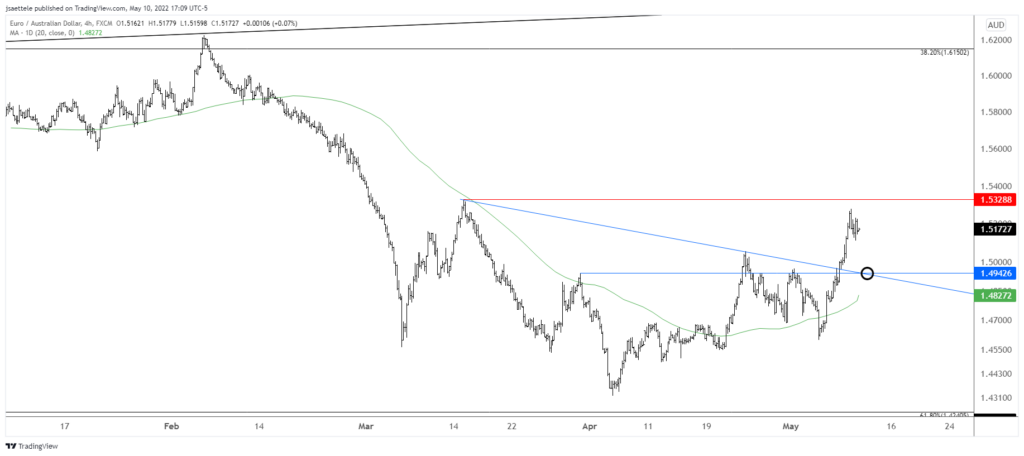
EURAUD sports a 2 month bottoming pattern (similar to the 2 month topping process in AUDJPY). Price is nearing the 3/15 high at 1.5329 which could produce a reaction lower. ‘Ideal’ support for a long entry is 1.4940s, which includes former resistance and the top side of the line off of the 3/15 and 4/25 highs.
EURCAD 4 HOUR
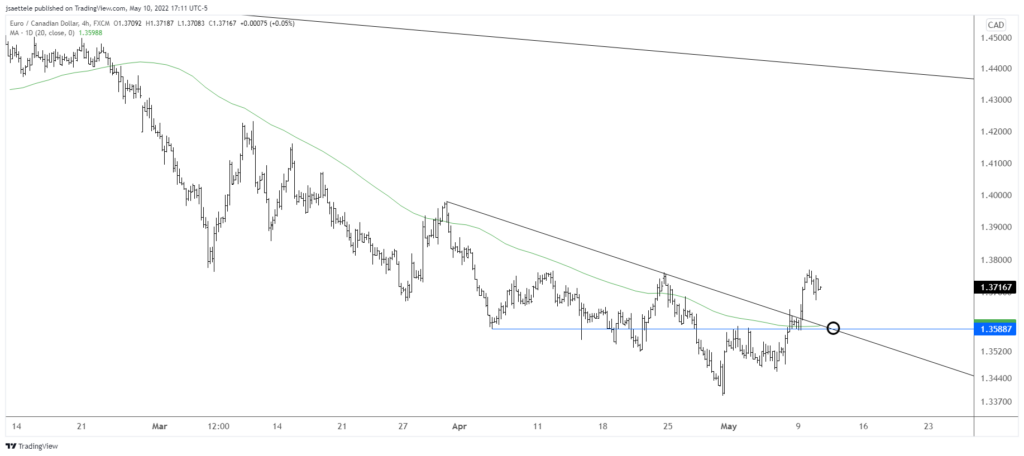
EURCAD also looks promising on the upside following the break above month long trendline resistance. The top side of that line intersects with the well-defined 1.3590. The 20 day average, which was recently resistance, is also in the vicinity. Bottom line, I’m looking to buy 1.3590. Initial upside focus is the January low at 1.4100.


