Market Update – June 3
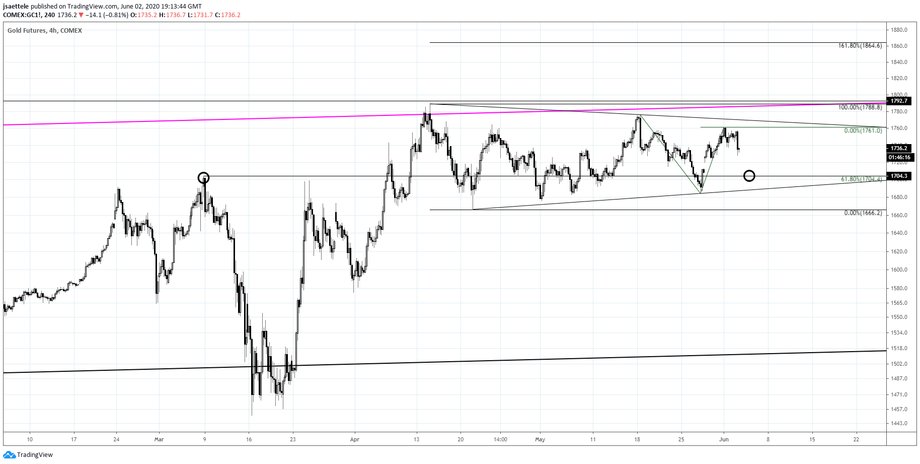
GOLD FUTURES 4 HOUR
Gold is in its 8th week of sideways trade but that may be about to end. The drop from yesterday’s high is the 5th leg within the triangle consolidation. A level to note for support is 1704.40, which is 61.8% of the alternating leg. My ‘bias’ is that gold finds support there and then breaks out to the topside. Be nimble (always) though because a drop beneath 1684 would indicate that the sideways trade is a consolidation top.
SPOT GOLD (XAUUSD) 4 HOUR

For spot gold, the level to watch for support is 1713.60. Again, my view is that price finds support there before turning up and eventually breaking to new highs.
USDOLLAR DAILY

USDOLLAR is trading right at proposed 12347 support. This is the December 2018 high and parallel that extends off of the January 2018 low. This parallel was support on the last day of December 2019. The trend is lower but if there is going to be a bounce then this is a good place for that to occur.
5/29 – The other USD index that I follow, USDOLLAR, is nearing the noted 12347. Another level that I would be aware of for a possible bounce is the December 2018 high at 12375. The underside of the 2011-2014 trendline (magenta line) is likely resistance near 12480.
USDJPY HOURLY

After going silent for 3 weeks, USDJPY finally broke to the upside. Today’s close is actually right near the year open (year open is 108.76). Near term focus is 109.38/53 (April high and 61.8% retrace of decline from the March high). Support should be the high volume level from today at 108.30.
AUDUSD DAILY

AUDUSD is pressing the top of the proposed zone for resistance (.6900). The level is defined by a parallel within the channel from the 2011 high and the September 2015 low. The next chart shows a Schiff fork (magenta structure) from the March low. Price is testing the upper parallel. A short trigger for me would be either a volume reversal (at least 4 hour) and/or a thrust through the upper parallel of the Schiff fork followed by a reversal back below. If price does reverse lower, then .6750 is the first level I’d pay attention to for support.
5/29 – AUDUSD has taken out the critical .6680 level, which has been significant since August 2019. As long as price is above this level, focus is on the gap from 1/24 at .6823. This is also the top of the short term channel that we’ve been following. Generally, .6800-.6900 is an important zone defined by parallels within the channel from the 2011 high (see weekly chart below) and should be watched for resistance.
AUDUSD 4 HOUR

AUDUSD 1 MONTH EIDOSEARCH

EidoSearch also suggests that AUDUSD is at risk of a reversal. EidoSearch employs a proprietary algorithm in order to find the closest pattern matches over a specified amount of time. In this case, pattern matches span the last 3 months of price action. There are 12 close matches. In 9 of the instances, AUDUSD was negative 1 month later. The average loss was 2.7% (186 pips at the current level) and the largest loss was 7.2%. The average gain was 0.3% and the largest gain was 0.7%.
Finally, AUDUSD news headlines are consistent with a rally at risk of a pullback (see below).
AUDUSD NEWS HEADLINES (GOOGLE NEWS SEARCH)

The following is from Sentiment in the Forex Market, which is wrote over 10 years ago.
Headlines that contain strong language and/or that take a directional stand are fantastic contrarian signals. How you use this information is up to you, of course. You might use the actual headline as an exit strategy and wait for a higher probability entry (see “Determining a Bias” in Chapter 6). Or, if a headline occurs when other information indicates that a change in trend is a high probability (COT, consecutive periods in one direction, and so forth), then acting on the signal is probably warranted. In any case, understand that this is a risky trade outright. These headlines appear after a sharp move in price when conditions are volatile. Also, if the market is at a multiweek/month/year high or low, then there is no simple answer to the question “Where do I place my stop?”
EURUSD 4 HOUR

EURUSD nearly made it to 1.1200 today. Whether or not price takes out today’s high, I am ‘thinking’ pullback with support in the 1.1080-1.1100 zone. The upper parallel of the channel from the March low is an eventual target near 1.1350.
5/29 – EURUSD is trading just above the channel from the 2019 high so immediate focus is on 1.1200. Watch for support from the top of the channel and center line of the channel from the March low, which is 1.1075/95. If that fails to hold, then the noted 1.1020 is the next spot to consider longs.
EURAUD WEEKLY

EURAUD has reached the 25 line within the channel from the 2011 low. This line has held (allowing for slight dips below) as support since August 2017. Bottom line, this is a huge level so respect potential for a turn higher.


