Market Update 7/12 – USD Correcting Lower
NASDAQ FUTURES DAILY
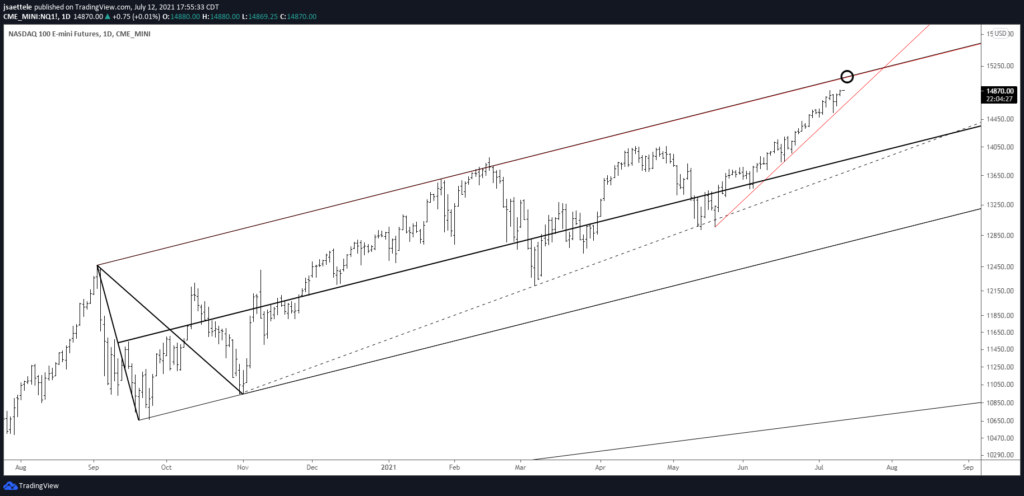
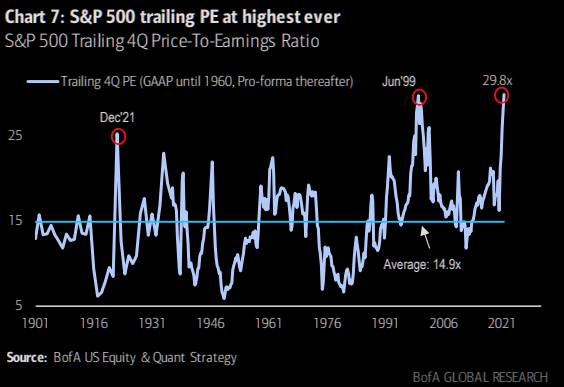
Apologies in advance for noting possible resistance in NQ. The number to know is roughly 15060, which is defined by the upper parallel from the channel that originates from the September low. On an extremely long term basis, know that the trailing 4Q PE for the S&P 500 (see below) just reached a record. The prior record was in June 1999.
S&P 500 TRAILING PE
EURUSD DAILY
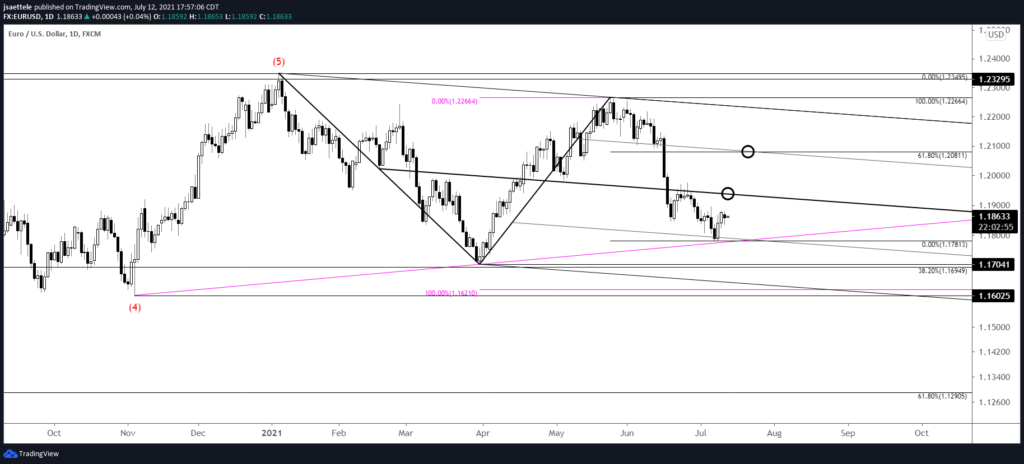
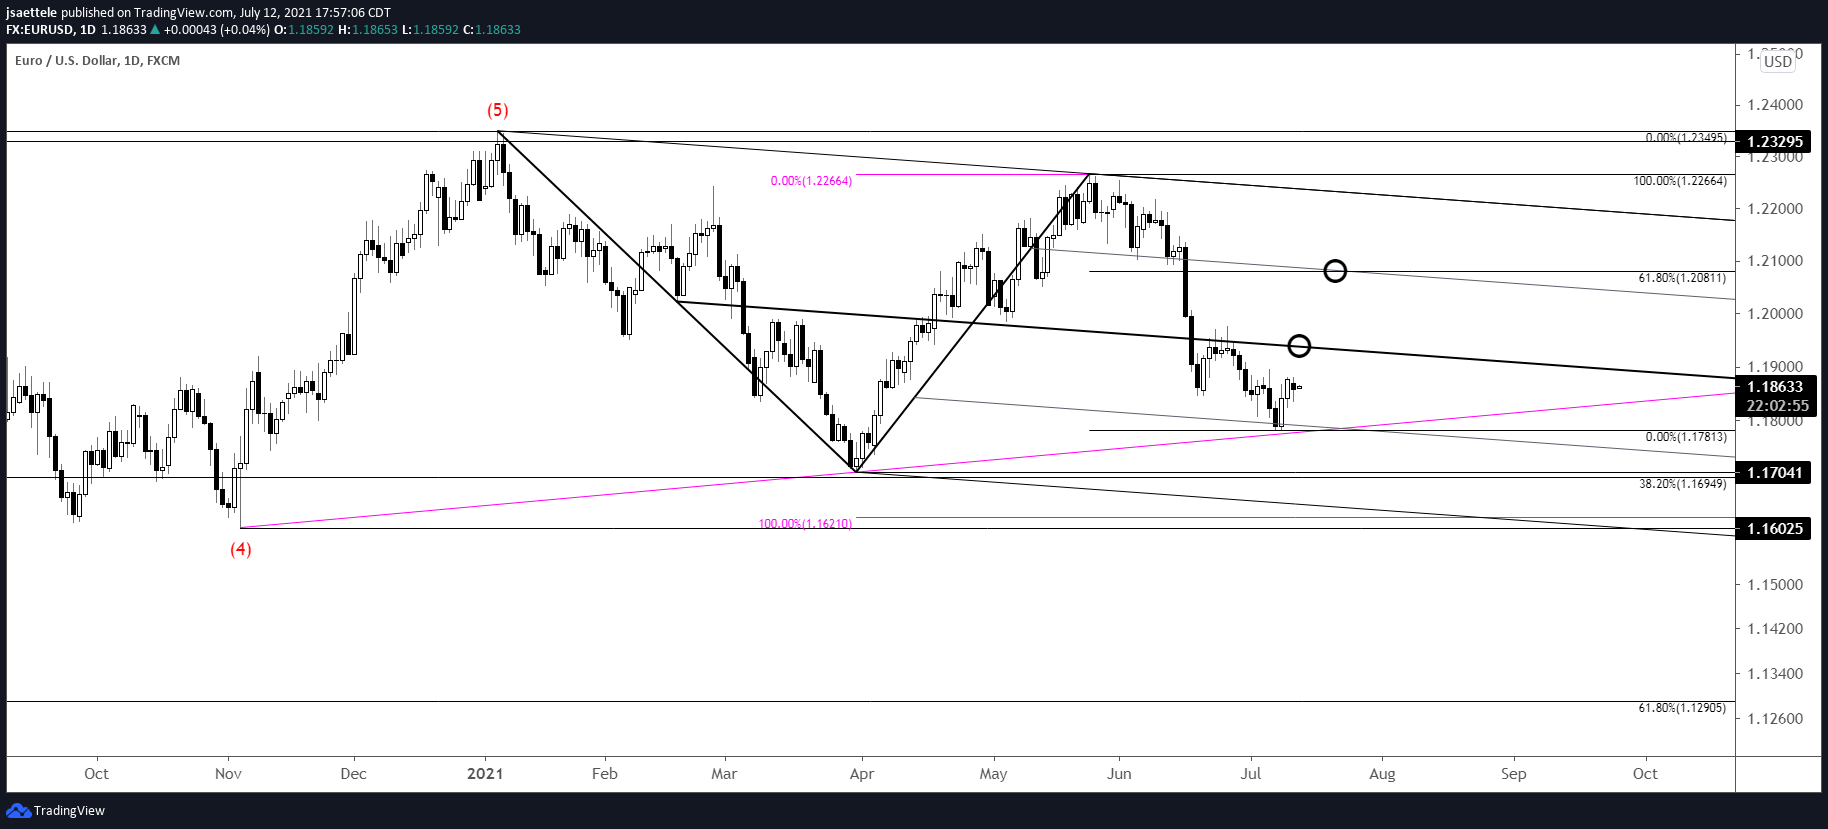
EURUSD held VWAP from the 2020 low (again) so near term focus is higher towards the center line of the channel from the January high, which is about 1.1935. Importantly, notice that the 75 line provided support therefore the 25 line is proposed resistance if reached (as per median line symmetry). The 25 line intersects the 61.8% retrace of the decline from the May high at 1.2081. Watch for support near 1.1825.
7/7 – FOMC minutes were today and the ECB version is tomorrow. Price is just pips from the noted 1.1770 level (remember that’s a possible bounce level). Price is currently at VWAP from the 2020 low, which was support for the March low. Bottom line, EURUSD is into a zone that could lead to a strong bounce. If reversal evidence arises, then I’ll let you know and look to take action.
GBPUSD DAILY
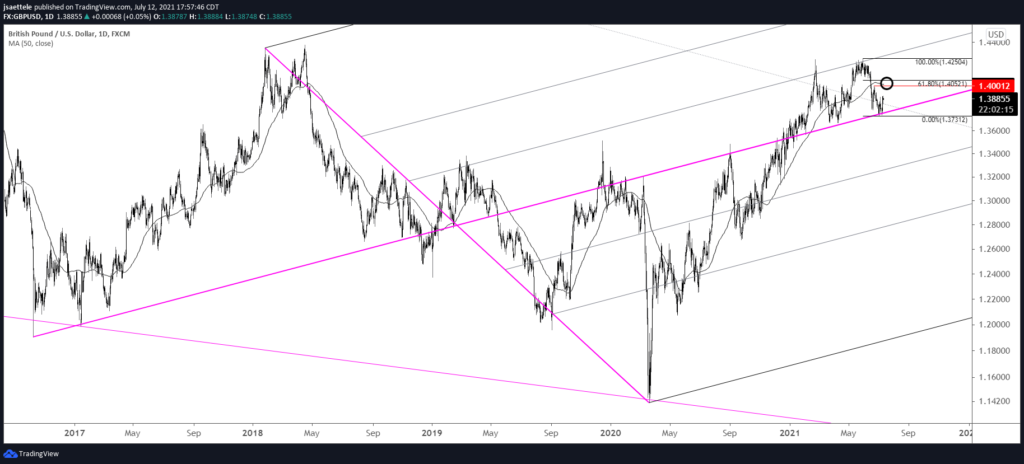
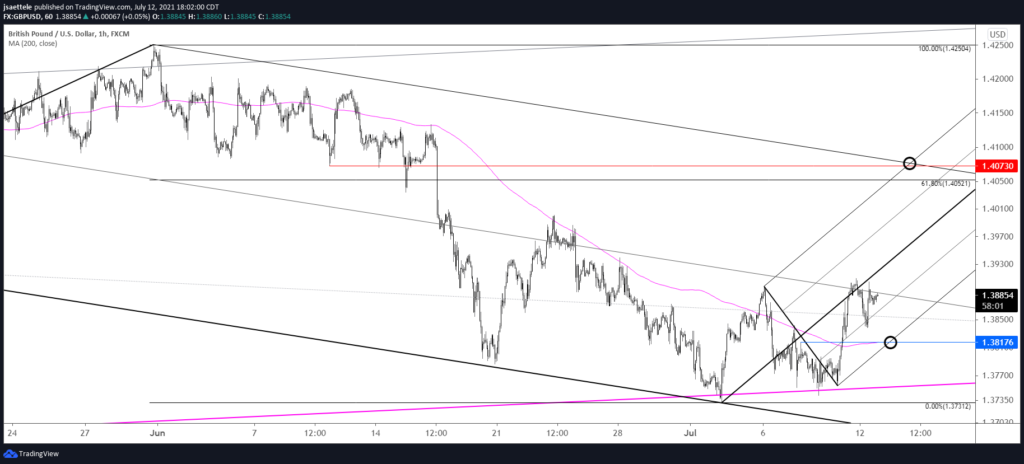
GBPUSD has reversed higher from the long term median line, which supports the idea that an advance is underway in order to correct the 5 wave decline from the 6/1 high. 1.3820 is a spot to keep in mind for a higher low. Upside focus is 1.4000 followed by 1.4050/70 (61.8% retrace and former support…see the hourly chart below).
7/6 – Cable nailed support and reversed higher after NFP last week. Support is well-defined from multiple forks (see below) and the decline counts in 5 waves. Today’s pullback may compose wave B of a 3 wave rally. I am looking higher as long as price is above last week’s low. 1.4000 is proposed resistance.
GBPUSD HOURLY
AUDJPY HOURLY
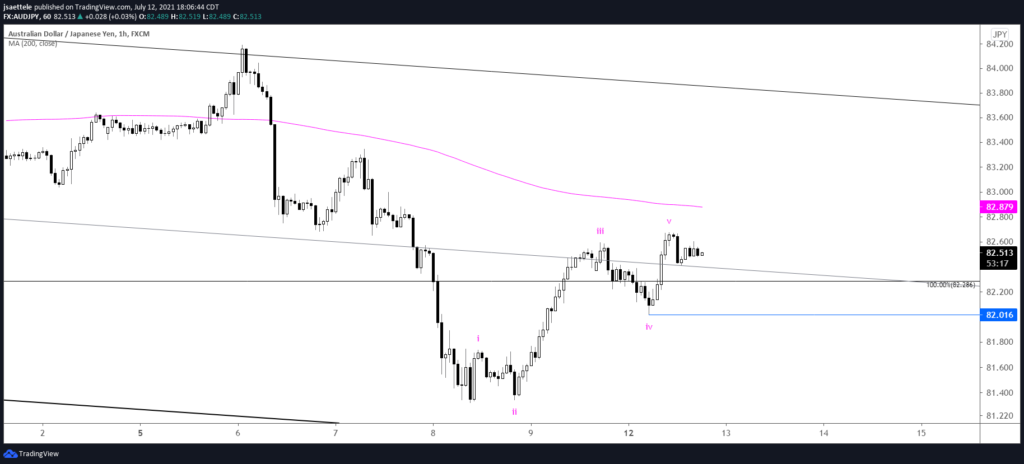
The AUDJPY rally is in 5 waves so expectations are for a pullback followed by another leg higher. The former 4th wave low is in line for support at 82.02. Watch for a higher low near that level.
7/8 – AUDJPY is playing out beautifully. The cross broke down today but 81.00 looks as possible support from the 200 day average, January high, and a long term neckline (blue line). I’m also watching the structure on the 4 hour chart below for clues. The median line is about 81.00. A bounce from there would ‘make sense’ and 82.30 (former lows and 25 line) would be in line for resistance.
CADJPY HOURLY
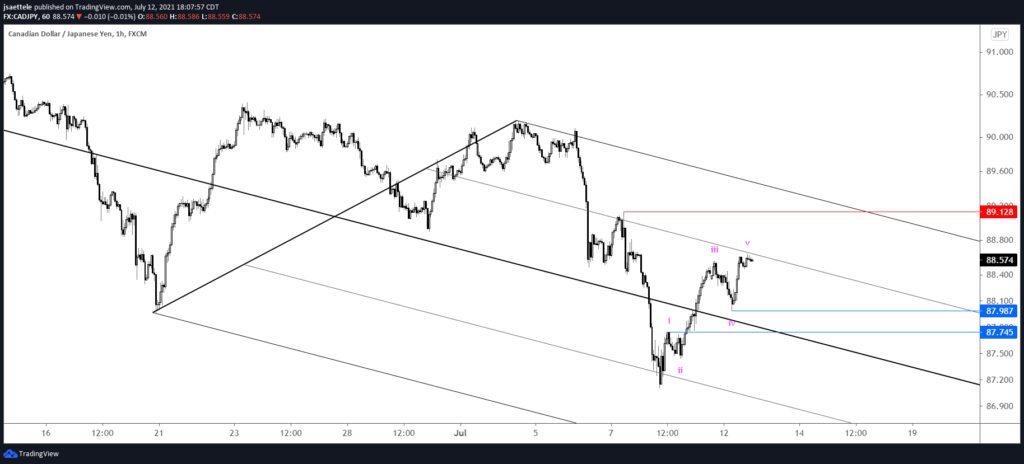
The CADJPY rally is also in 5 waves. As such, I’m looking for a pullback followed by another leg up. 87.75-88.00 is proposed support. I’ll think about the downside again after price takes out 89.13.

