Market Update 2/15 – Gold Re-Test and USDJPY Setup
SPOT GOLD 4 HOUR

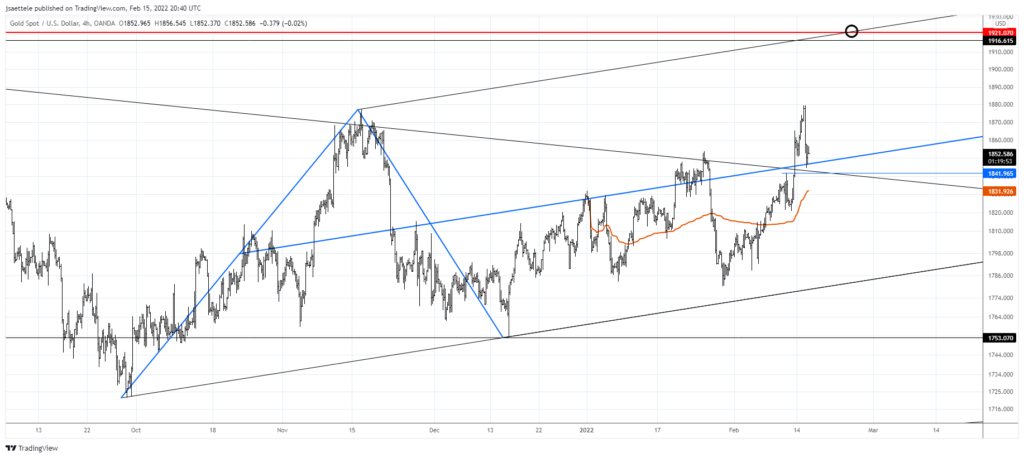
Gold has pulled back to support defined by the center line from the channel that originates at the September low. A dip under today’s low to test 1842 isn’t out of the question. The top side of former trendline resistance needs to hold as support in order to maintain a bullish stance and look towards 1920.
2/14 – Gold has broken out and the next level to focus on is 1920. This is near the June high and possible channel resistance from the channel that originates at the September low. It’s also the 2011 high. If price pulls back then support should be 1842/47. The top of this zone is the center line of the noted channel. The bottom of the zone is the top side of former trendline resistance.
SPOT SILVER 4 HOUR

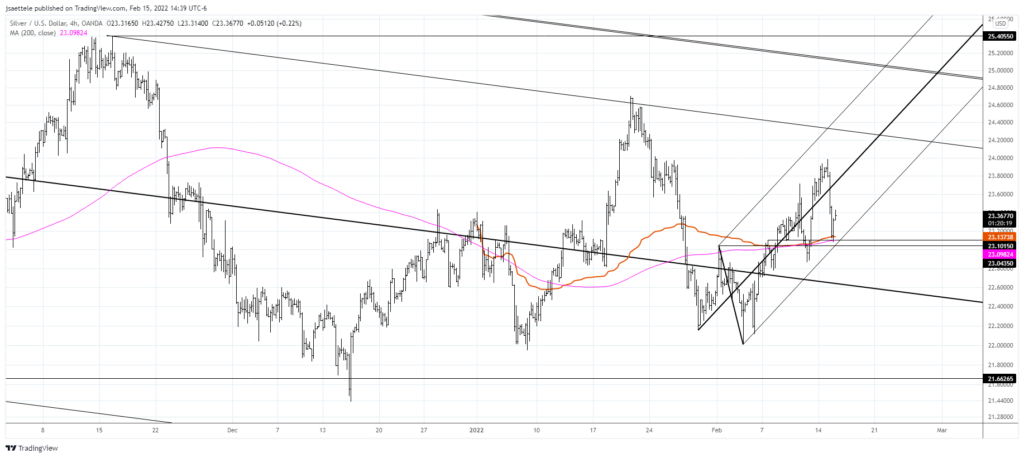
Silver has also pulled back to support. The level is defined by the February 7th high and 2022 VWAP. It’s important to note that silver never broke out so the bullish setup isn’t nearly as ‘strong’ as the gold setup. As such, this support needs to hold otherwise silver risks heading towards range lows.
CRUDE OIL (WTI) HOURLY

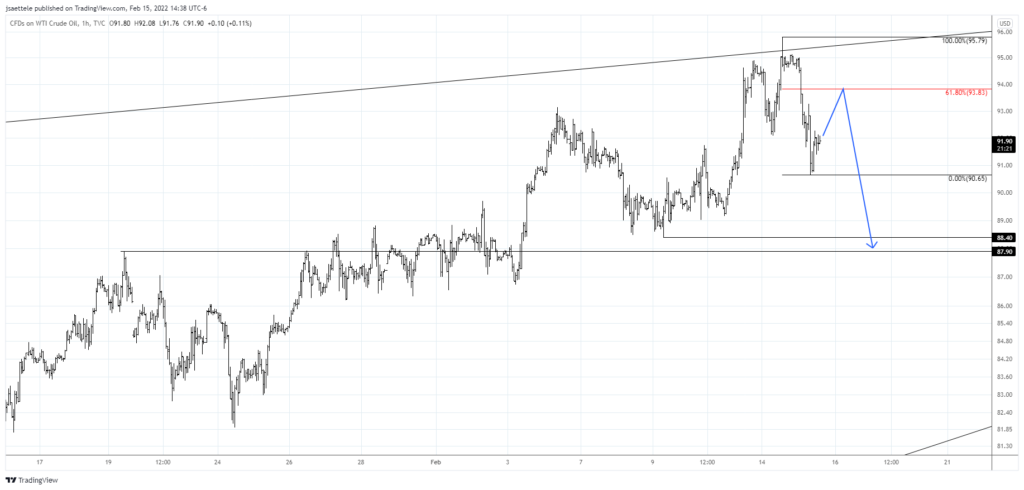
How about that timing? Crude tanked off of the expanding wedge line today. The drop appears impulsive so the 61.8% retrace of the decline at 93.83 is a candidate for resistance. A near term level to pay attention to on the downside is 87.90-88.40. Much more bearish potential exists but that’s that first spot to pay attention to.
2/14 – Crude is pressing against the line that connects the 2021 highs. This is simply the top of an expanding wedge…some may call it a megaphone pattern. Volume has picked up the last 2 days, indicating possible upside exhaustion. I’m on reversal alert.
USDJPY HOURLY

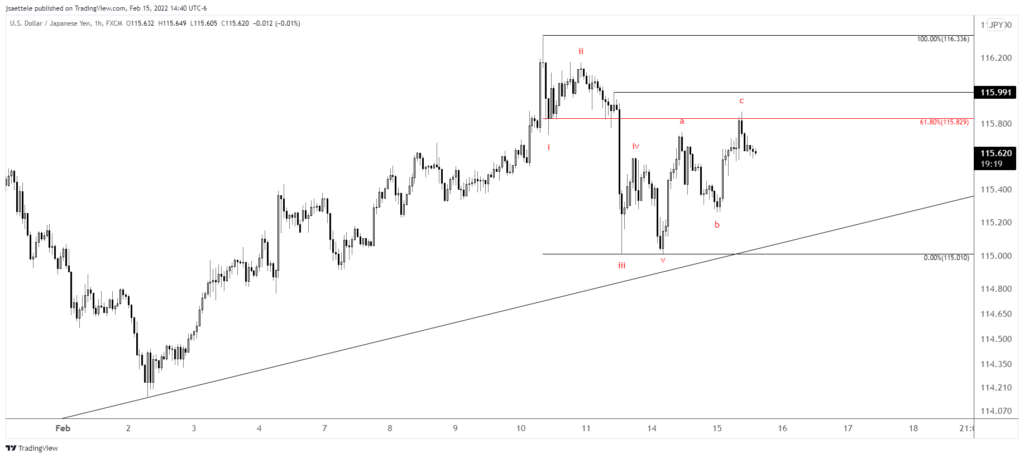
USDJPY reversed lower from the noted 61.8% retrace today. The bounce is a ‘textbook’ 3 wave advance so focus is lower for a drop under 115.01 at minimum. Daily reversal support (1/24 close) at 113.93 is a level to keep in mind.
2/14 – USDJPY came within 1 pip of the January high last week before reversing lower. Price left a doji on the weekly candle chart, which indicates indecision and therefore reversal potential. The decline from last week’s high counts in 5 waves too so watch for resistance near 115.83 (61.8% retrace).


