Market Update 2/14 – Gold Breakout and Crude Resistance
SPOT GOLD DAILY
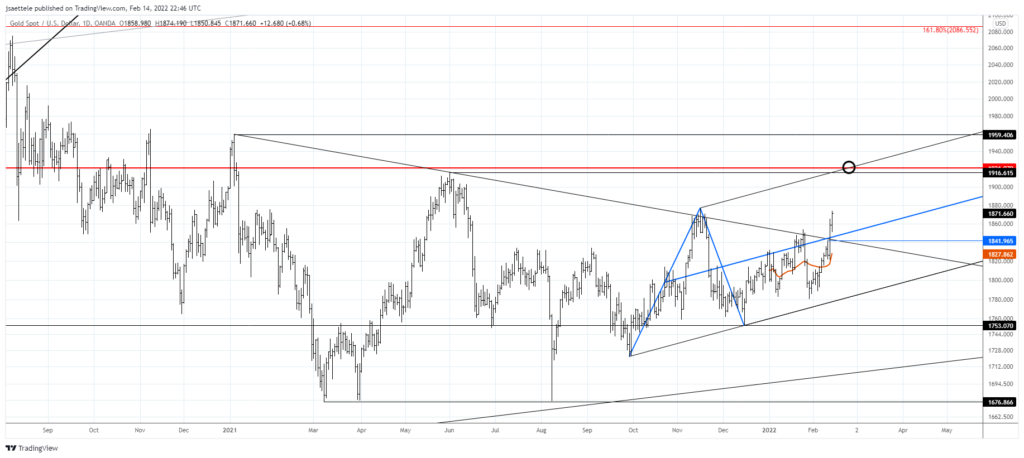
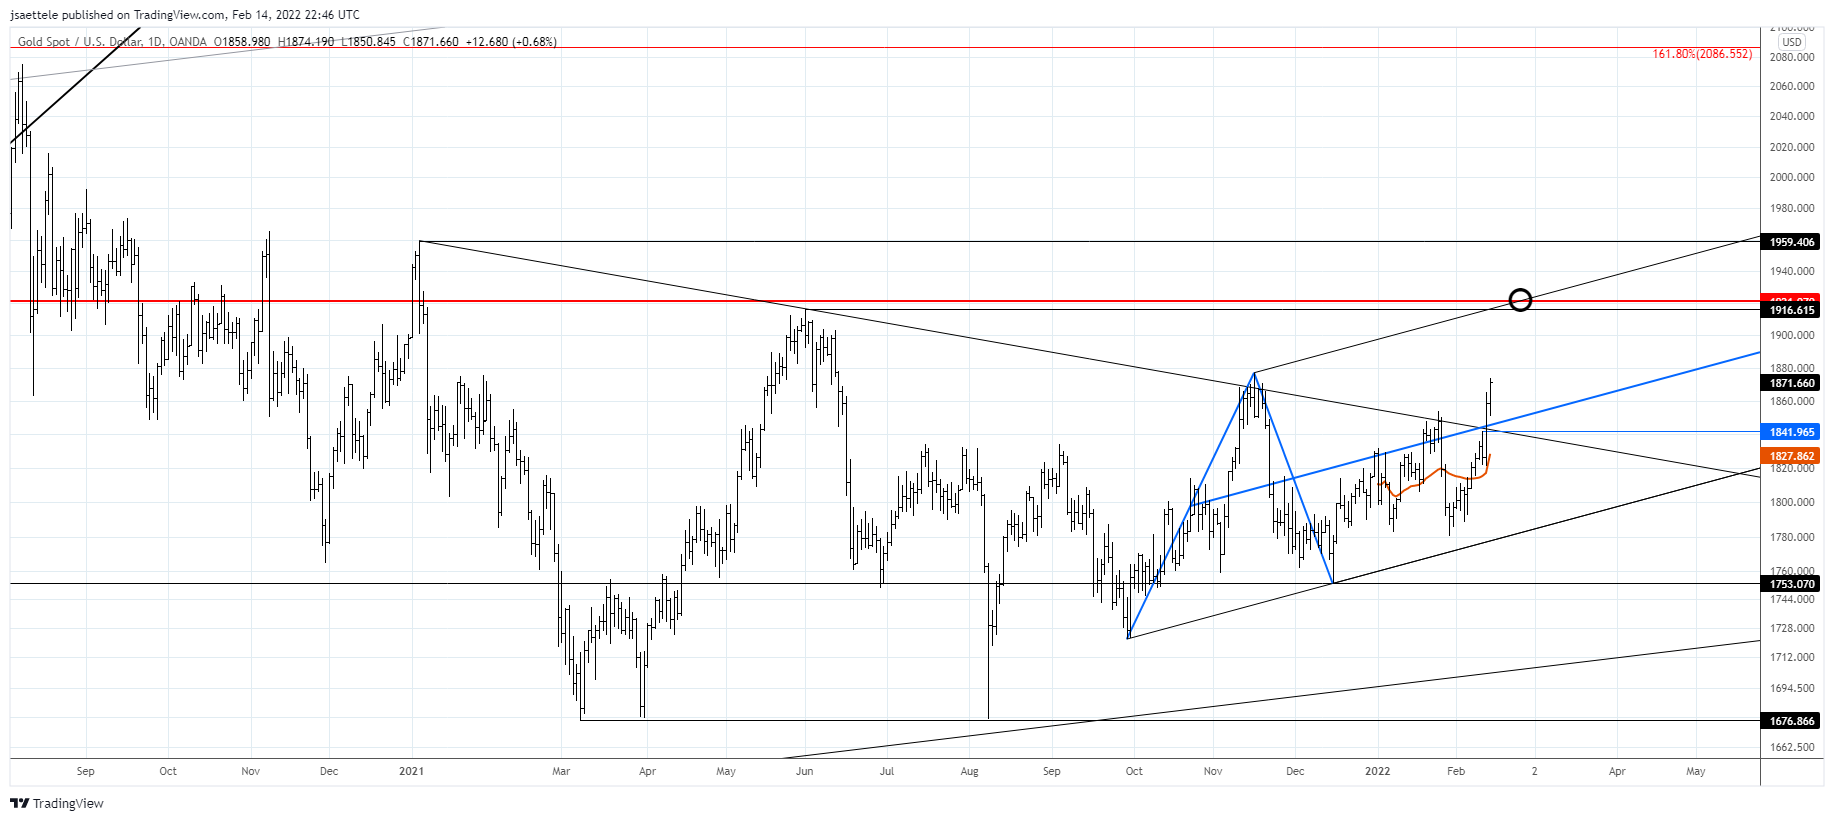
Gold has broken out and the next level to focus on is 1920. This is near the June high and possible channel resistance from the channel that originates at the September low. It’s also the 2011 high. If price pulls back then support should be 1842/47. The top of this zone is the center line of the noted channel. The bottom of the zone is the top side of former trendline resistance.
2/8 – I’ve been focusing on near term gold levels recently, which have played out well. 1815 was support today for example. However, don’t forget the big picture! Gold has been ‘coiling’ for over a year and is just under the trendline that originates at the January 2021 high. A break above this line would suggest at least a test of the 2020 high. Finally, notice the perfect channel re-test (channel from 2015 low).
CRUDE OIL (WTI) DAILY

Crude is pressing against the line that connects the 2021 highs. This is simply the top of an expanding wedge…some may call it a megaphone pattern. Volume has picked up the last 2 days, indicating possible upside exhaustion. I’m on reversal alert.
ETHUSD 4 HOUR

ETHUSD did indeed pull back from noted resistance and has reached support from the lower parallel of the Schiff fork. I’m expecting a bounce with resistance near the 61.8% retrace of the decline from the high at 3111.
2/8 – ETHUSD has traded into (and slightly above) the proposed resistance zone. Still, price did respond to a negative trendline so it makes sense to think lower at the moment. Watch for support near 2926 and 2725. The latter level is more important. Proposed resistance is 3155.
GBPUSD 4 HOUR

The expanded flat appears to be playing out. A drop under 1.3490 would satisfy the minimum requirement for wave c. Proposed support remains 1.3450/60.
2/9 – GBPUSD is following the near term script laid out yesterday. Today’s high is probably wave b within the 3 wave corrective drop from last week’s high. Therefore, wave c is underway towards 1.3450/60 (2 equal legs down, month open, and 61.8% retrace). That’s the zone for the next low.
USDJPY HOURLY

USDJPY came within 1 pip of the January high last week before reversing lower. Price left a doji on the weekly candle chart, which indicates indecision and therefore reversal potential. The decline from last week’s high counts in 5 waves too so watch for resistance near 115.83 (61.8% retrace).
2/7 – USDJPY continues to press against the upper parallel of the channel from the March 2020 low. Also, don’t forget about the long term 61.8% retrace at 115.52. I’m looking for price to roll over. Weakness below 2022 VWAP at 114.80 would serve as the trigger for a short.
EURJPY HOURLY

EURJPY also declined in 5 waves from last week’s high. The implication is that price recovers, albeit in 3 waves. Ideal resistance is the 61.8% retrace near 132 although I’d also be aware of the former 4th wave high at 131.40 for resistance as well. Last week’s high is right at the line that connects the June and October highs (see below) so I favor shorting a bounce into the mentioned levels. Initial downside focus is the line that extends off of the December and January lows near 128.60.
EURJPY DAILY


