Market Update 12/2/2021 – More USD Bearish Signs
CRUDE OIL FUTURES (CL) DAILY
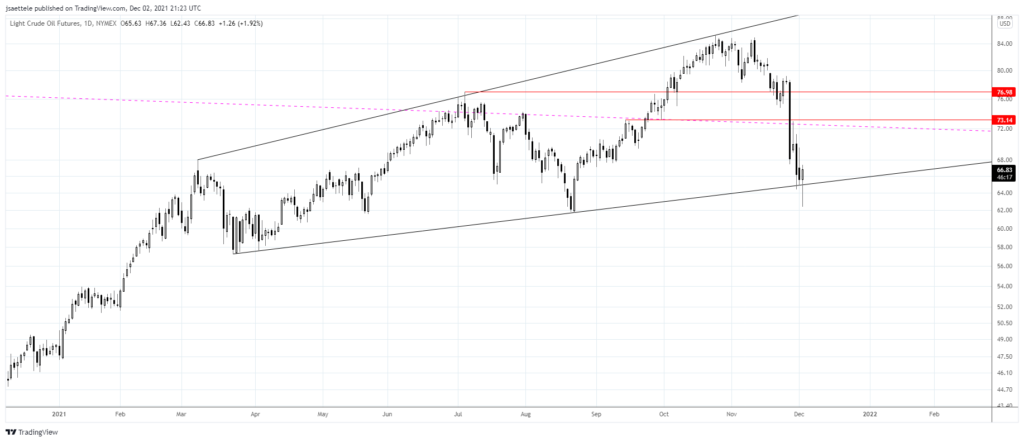
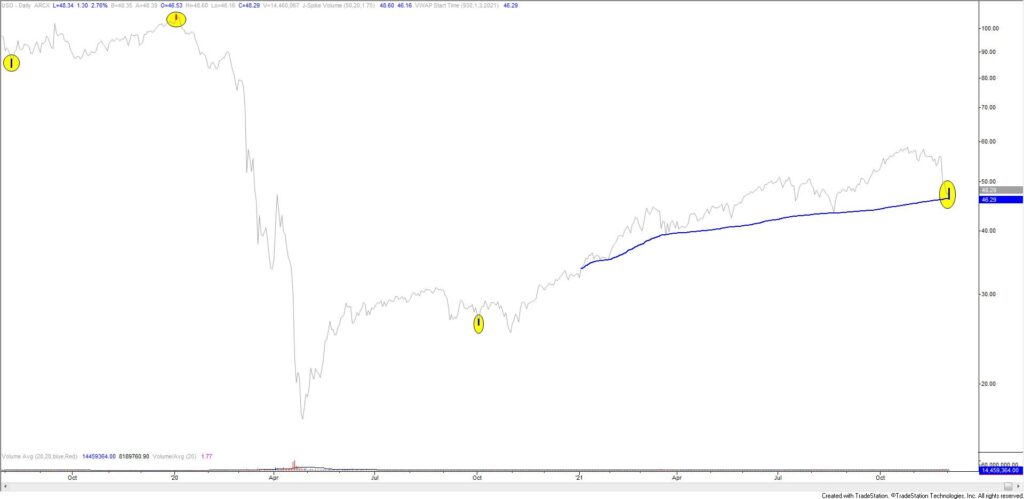
Crude reversed sharply higher post puke today. The argument for a bounce is stronger after today’s action, in part due to a high volume reversal from 2021 VWAP (see below). Immediate focus is on 73.00ish.
11/30 – Crude entered ‘bear market territory’ today (20% drop). Interestingly, the low was at the line that extends off of the March and August lows. As such, I’m thinking bounce with resistance near 72.90. However, this level has to hold otherwise there is risk of additional free fall. I mention this because 2020 VWAP is also just under today’s low in USO (see below) and volume today was exceptionally high. The red/blue bars on the next chart denote 50 day lows/highs with volume at least 2.5x 20 day average volume. In recent years, volume of this magnitude on the downside has NOT marked lows. Rather, we tend to get a violent bounce followed by additional weakness.
USO DAILY
COPPER FUTURES (HG) DAILY
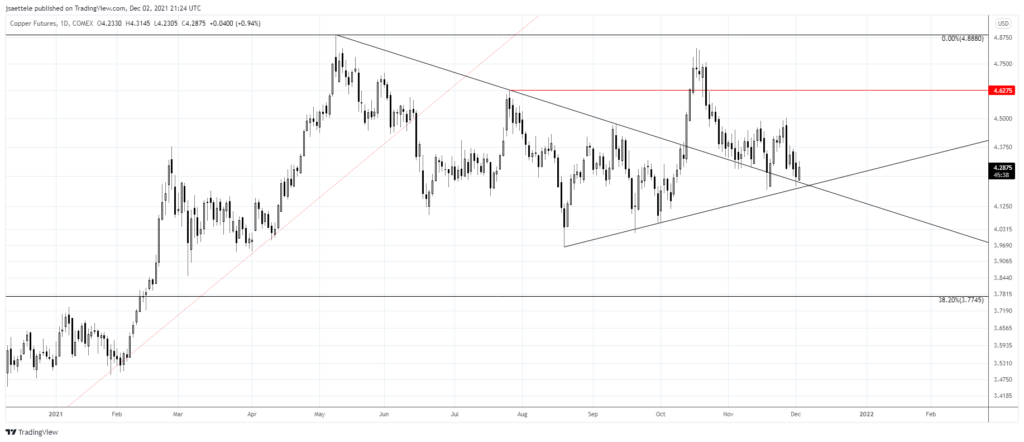
We last looked at copper a month ago…it hasn’t gone anywhere! I continue to think bounce with 4.6275 resistance. From an intermarket perspective, near term constructive looks on copper and crude suggest USD downside along with positive risk and carry.
11/3 -Copper reacted to the top side of former trendline resistance so I’m thinking bounce. The 200 day average is also just below the market. Pay close attention to 4.6155-4.6275 if reached for resistance. This is the 61.8% retrace of the decline and July high.
SPOT GOLD 4 HOUR
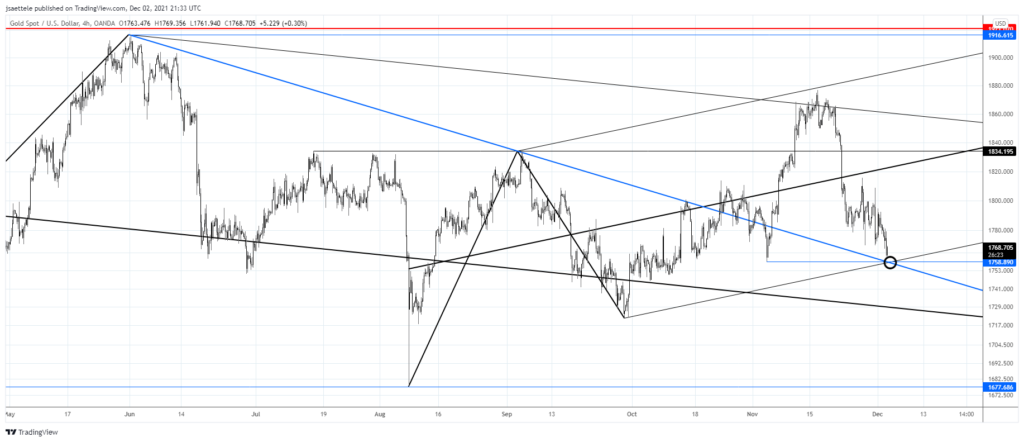
Gold is trading right at 1769. I like the yellow metal down here but we might get a tag of 1759 to take out the November low before ripping higher.
11/23 – Remember the gold ‘breakout’ above the critical 1834. It was short lived and the yellow metal has been slammed lower the last few days. Focus is squarely on the slope confluence (blue lines) near 1769. That level needs to provide support in order to hold a constructive view.
TLT (LONG BOND) DAILY
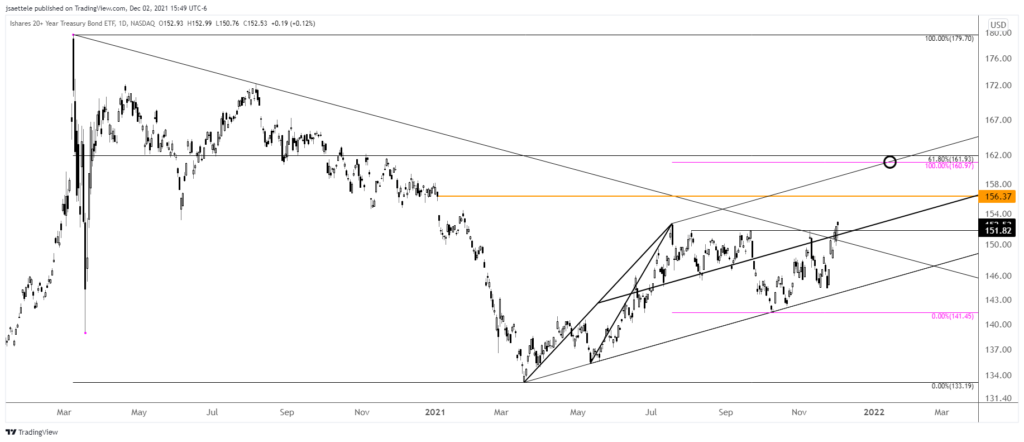
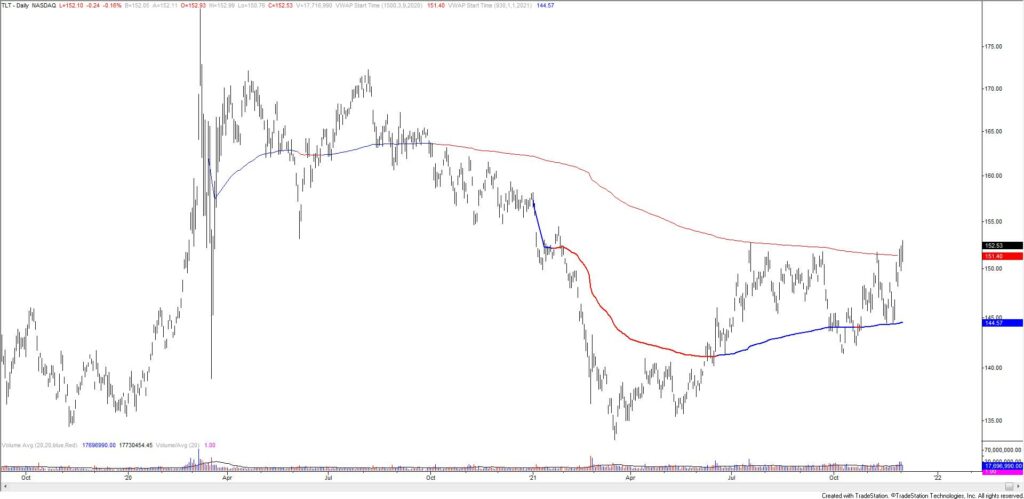
TLT is breaking out just as Powell capitulated and dropped ‘transitory’! You can’t make this stuff up. Anyway, I’m positive TLT towards 161-162 over the next few months. This is 2 equal legs up from the March low and the 61.8% retrace of the decline from March 2020. At that point, Powell might adopt ‘transitory’ again. Also, note the beautiful action around VWAP lines (see below). Price pulled back after 11/9 and found support right at 2021 VWAP.
11/9 – TLT is testing massive resistance from the line off of the March and August highs. 2021 VWAP is also up here (see chart below). I’m thinking pullback here (not sure on support yet), which jives with the gold chart in yesterday’s post (also at resistance).
TLT DAILY
USDOLLAR 4 HOUR
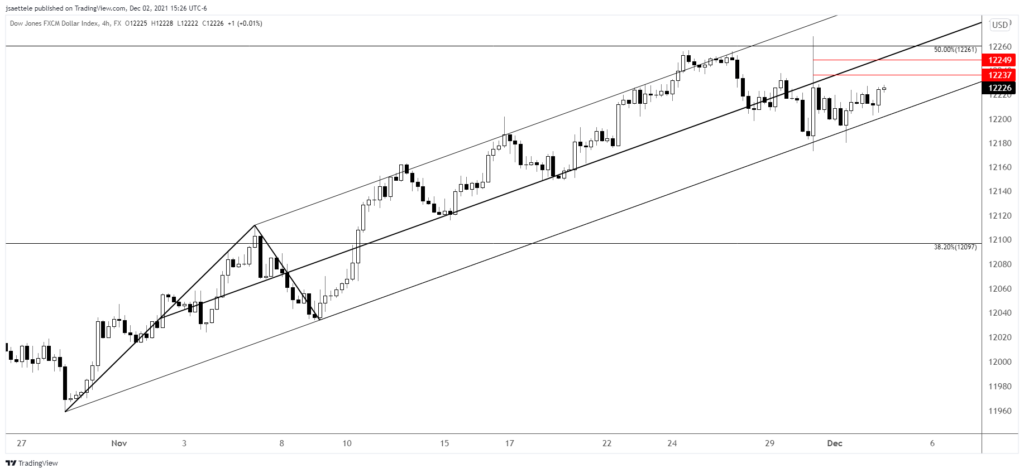
We got a prediction headline. The following is courtesy of the WSJ. Whether Omicron Wreaks Havoc or Not, the U.S. Dollar Is a Buy
Prediction headlines indicate extreme confidence in the direction of the trend. This is the same psychology that led to Powell capitulating on inflation. I’m extremely bearish the USD. Whether or not we get a spike higher following NFP is a complete guess but pay attention to this short term channel in USDOLLAR. A break below would serve as the ‘all clear’ that the USD is about to dump.
11/22 – The DXY rally is relentless but pay attention to 97 or so. This is the underside of the former support line that originates at the 2011 low. This line was resistance in 2020 so watch for resistance at the line again. Sentiment is getting interesting too. A google search for ‘US Dollar’ reveals stronger, active language (see below). If we extend a bit higher, then we may start getting predictions within headlines which would be a stronger indication of extreme sentiment and therefore increased risk of a price top. Finally, DXY tends to top out this week from a seasonal perspective (see 2 charts down). Bottom line, there are signs of extreme sentiment and 97 is a big level.
USDJPY 4 HOUR
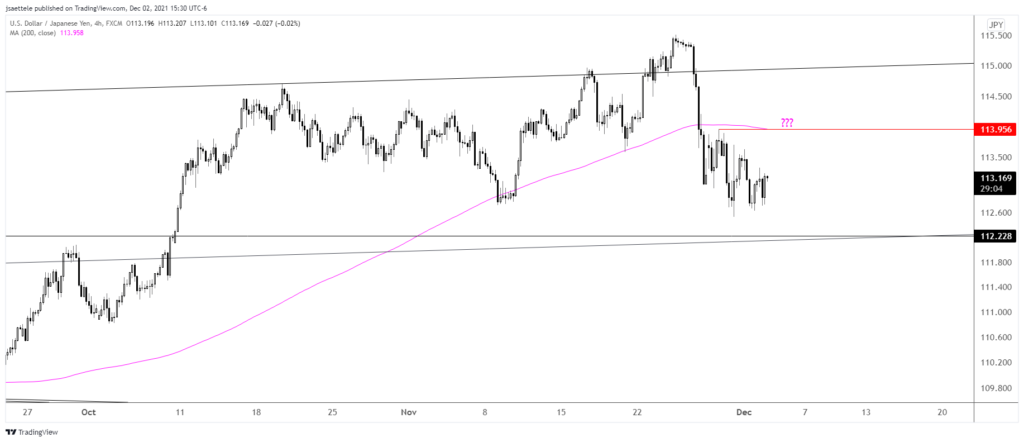
No change but you’ll want to have this chart front and center with NFP tomorrow. I want to short USDJPY near 114.
11/30 – Despite today’s wild ride, I don’t have much more to add regarding USDJPY. I’ll note 114.00ish as resistance though. This is Monday’s high and the underside of the 200 period average on the 4 hour chart. This average was support in November. The weekly chart below shows weekly reversals (J-Spikes…price based only) at one year lows/highs. Nothing works all of the time but I love the combination of the reversal signal from the well-defined 115.50.
GBPJPY 4 HOUR
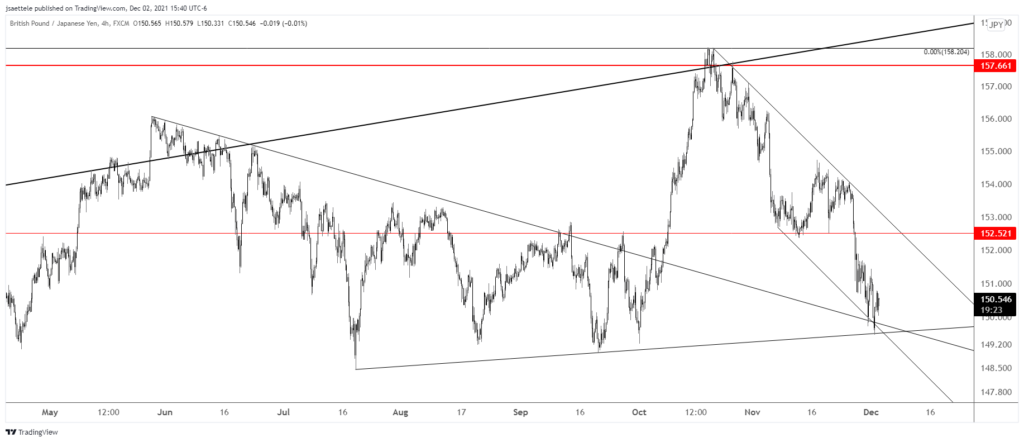
GBPJPY is interesting for a bounce. Price reversed higher today from a trendline/channel confluence. Strength into the well-defined 152.50 or so makes sense.


