Market Update – May 13
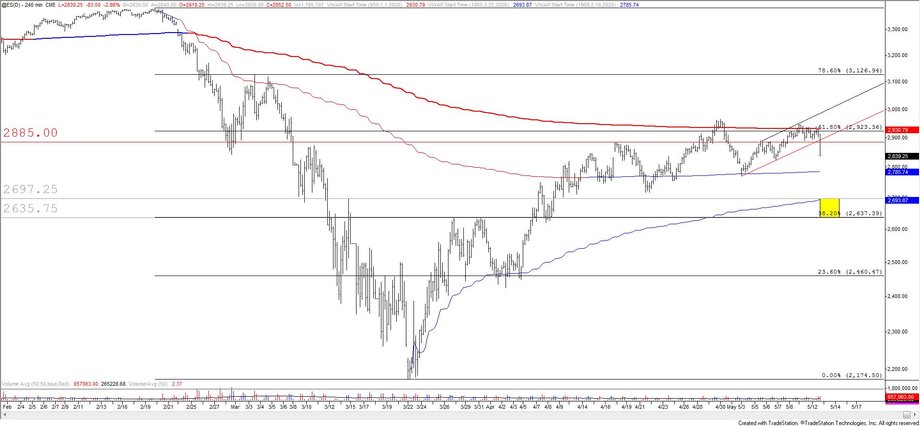
S&P 500 FUTURES (ES) 4 HOUR
ES broke the noted level at the end of the day. 2885 is now resistance if reached and general focus is towards the 2637/97 zone (yellow box). The bottom of this zone was resistance in March. It’s also the 38.2% retrace of the decline from the February high. The top of the zone is VWAP from the low and the 3/13 high.
5/11 – The S&P (looking at SPY here) remains magentized to the 61.8% retrace of the decline from the high. This is also the September 2018 high and May 2019 high (that’s right…exactly flat over the last year). Good spot to turn down? The daily RSI profile is also bearish as the indicator has been bumping against 60 for nearly a month after registering an oversold condition. On futures (see below), a break below the short term channel (from 5/4 low) near 2885 would serve as my bearish signal.
USDOLLAR HOURLY

Textbook action in USDOLLAR! The pullback found support from the 200 hour average and topside of the April trendline. My view is that wave 3 of C is underway towards 12700 or so. This should be a sharp advance.
5/10 – Price action since the 4/30 low can be labeled as a 5 wave rally and 3 wave decline. Friday’s low is at the 61.8% retrace of the 5 wave rally so it’s possible that Friday’s low marks the wave 2 of C low. I also like that the low is on ‘news’ (NFP). Let’s see early week action shakes out but my bias is higher.
AUDUSD 30 MINUTE

I’m zooming in on AUDUSD action to show the short term bearish fork. Today’s low and high were exactly at the median line and upper parallel. This action increases confidence in the short setup. As the decline progresses, we should be able to identify resistance (places to increase shorts) on parallels within the fork…whether the 25 line or median line. Bottom line, I’m bearish and will follow short term action closely for additional short entries.
5/11 – AUDUSD finally rolled over and focus remains lower in order to correct the 5 wave advance from the March low. Resistance should be near .6515 and initial downside focus is the May low (and long term channel center line) at .6373. Eventually, .6240/50s will be in line for support. This is VWAP off of the March low and the 4/21 low (see futures chart below). Finally, the current level is reinforced by 2020 VWAP and the high volume level from 2/28.
NZDUSD HOURLY

The short term bearish fork in NZDUSD is worth following as well. .6070 (red horiztonal line) is a key level. Watch for downside acceleration on a drop below that level. Other than that, there are no new comments.
5/11 – NZDUSD carved a bearish outside day today and the proposed wave count, in which wave C lower is underway, remains valid. If this interpretation is correct, then resistance should be about .6112. .5990 or so (trendline) is a possible bounce level. Ultimately, low .5700s is a candidate for a higher low against the March low. This is weekly reversal support, the 61.8% retrace, and a major long term parallel (see weekly chart below).
AUDJPY 4 HOUR

AUDJPY went back for another test of 70.00/20 in early U.S. trading before rolling over. The week open at 69.60 is proposed resistance now (10 minute chart below highlights setup for entry). 67.70-68.00 is initial downside focus.
5/11 – AUDJPY is testing a huge level. The August low, 61.8% of the decline from December, gap from 3/6, and trendline from the January high are 70.00/20. High today was 70.18, which is one tick above 4/30 high. Resistance is resistance until broken so I am looking lower right now.
AUDJPY 10 MINUTE

CADJPY DAILY

CADJPY has been consolidating below a 25 year trendline since early March and price just turned down from triangle resistance and 50 day average. Downside potential is significant (see the long term chart below…a bearish triangle break would set a target at 69.18, which is near the 2009 low at 68.71) but immediate focus is on the lower triangel boundary at 75.00. The week open is resistance at 76.45.
CADJPY WEEKLY


