Market Update – September 3
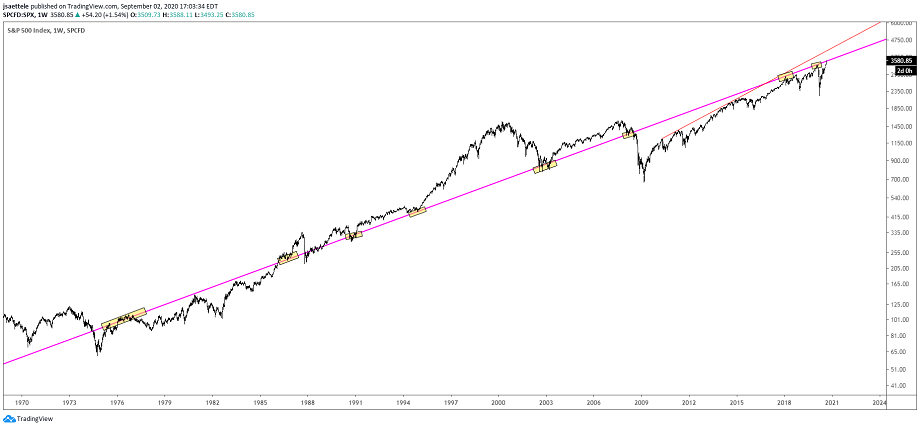
SPY and SPX (looking at SPX today to show more price history) traded through the line off of the January 2018 and February 2020 highs today. Let’s see where we finish the week though. Extending the line back in time reveals a lot of important pivots around or right at the line…I call this an ‘angle influence’. The monthly chart below shows that the line tags the 1932 and 1942 lows as well! Finally, I’ve shared several charts of tech names that made bearish volume reversals today (tech has been the high flyer).
8/31 – Pay attention to the line off of the January 2018 and February 2020 highs in SPY near 355 (1.6% higher from today’s close). Interestingly, the line extended to the left crosses the August 2008 high (lower high within that bear market), January and March 2008 lows, and lows in 2002 and 2003. On a closing basis, the 2002 and 2003 lows are right at the line. Bottom line, this line/angle has proved influential for nearly 20 years. Longer term charts are below.
SPX MONTHLY

CLDR DAILY

Reversals here have been awesome.
DOCU DAILY

Only the second bearish volume reversal since inception. The other nailed the March 2019 high. Today was the highest volume ever.
CRWD DAILY

Only the second bearish volume reversal since inception. The other did not identify a high. Today was the highest volume ever.
GOLD FUTURES DAILY

Gold continues to churn above the critical 2011 high. A break below would signal a massive bull trap/fake-out and probably lead to a downside acceleration. Failed moves lead to fast moves. Consider 1923 the trigger.
8/27 – Gold is sitting on top of the 2011 high…major level. A break below would open up 1765/90 (see hourly chart below), which is a well-defined zone and intersects the lower parallel of the Schiff fork from the high. Proposed resistance is 1941 (high volume level from today). As noted yesterday, I’ve been tracking near term fluctuations in GLD. High today was just above 185, which keeps the short term bearish channel intact (see yesterday’s GLD chart).
NZDUSD DAILY

NZDUSD remains firm (7th up day in a row today) as it tests the noted .6750-.6800 zone. Aside from the pivots mentioned last week, this is also the 200 week average and just above the 61.8% retrace of the decline from 2017. There is zero reason to be short here. I’m simply aware of the level as significant and will alert if reversal evidence arises.
8/28 – NZDUSD is pressing against a major horizontal zone. Keep it simple (I should do more of that). .6750-.6800 has been a significant pivot several times since 2017 (2017 low, July 2019 high, and December 2019 high) so be aware of potential for a turn lower. Still,, the most recent high volume level is .6629. As long as price is above there, I’m not fighting this move.
EURUSD 4 HOUR

EURUSD followed through on Tuesday’s reversal and 1.1750 remains the key level to break in order to indicate a trend change. In the interim, pay attention to 1.1900/10 for resistance. This zone includes highs in late July/early August and the spike high after Powell’s Jackson Hole speech.
9/1 – EURUSD tagged the median line noted on Sunday near 1.2000 (high today was 1.2011). Back down to a 1.1400 handle, which is former resistance from the 25 line and former highs, in the coming weeks/months wouldn’t surprise (see zoomed in daily view below). Below 1.1750 would break the channel from the 5/14 low and month long wedge (see 4 hour chart below). Euro futures made a bearish volume reversal today. A similar cluster of triggers occurred in early 2018 and at the 2014 high. A bearish volume reversal also triggered on FXE (ETF), which hasn’t occurred since the 2014 high! These charts are below.


