Market Update – July 1
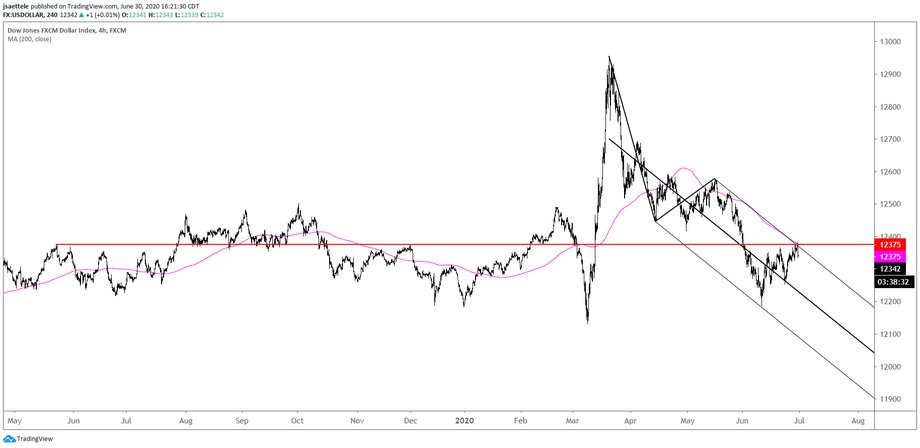
USDOLLAR traded 12383 today, not quite reaching the proposed resistance zone. However, that may be the end of the counter trend bounce. Price reversed right at the upper parallel from a Schiff fork, the 200 period average on the 4 hour chart, and at a level that has been support and resistance since May 2019 (red line). As long as today’s high is in place, risk is lower in my opinion.
6/25 – I’m looking at short term wave counts today in USD indices and the 3 cleanest USD pairs from a short term perspective. USDOLLAR focus is still on 12418/28. A flat pattern unfolded from the 6/15 high. The rally from 6/23 is impulsive so focus is on buying support, probably in the 12289-12304 zone.
GBPUSD DAILY

GBPUSD ha reversed higher from the 25 line of the fork from the September low. Recall that the 25 line was support in May. Simply, support held so I’m bullish. Initial focus is the underside of former trendline support. A pullback from 1.2400 (now) seems likely with the 200 hour average and short term trendline in the way (see hourly chart below). Proposed support is 1.2314/35.
GBPUSD HOURLY

AUDUSD HOURLY

The triangle idea is on track in AUDUSD although I’m questioning it with USDOLLAR failing at such a well-defined level. Even so, pay attention to .6940 or so for resistance. This is a slope confluence (Schiff fork from the March low is the upward sloping structure) and where the final leg of the triangle would equal 61.8% of the alternate leg (common relationship).
6/29 – AUDUSD is testing the line off of the 6/15 and 6/21 lows. Weakness below would warrant a short position with focus on .6680s and maybe .6570. Until price breaks lower however, strength is possible to complete the final leg of a triangle from the 6/15 low. If this happens, then proposed resistance is .6915 (high volume level from last week).
EURGBP 4 HOUR

Maybe Cable is REALLY bullish. I can make the bullish case for GBP crosses in general. EURGBP, for example, sports 5 waves down and 3 waves up since the March high. The 3 wave rally retraced almost exactly 61.8% of the 5 wave decline. .8980-.9000 is the breakdown zone.
GBPJPY HOURLY

GBPJPY action since the March low fits neatly within the confines of a Schiff fork. The lower parallel was support last week and again this week. The 25 line near 134.60 is a possible pausing point but swing focus is on the median line near 137.00. Support should be near 132.70.
GBPAUD WEEKLY

GBPAUD could turn up here too! A parallel based on the trendline from the 2013 low was support today. This parallel was support for the last 2 big lows in December 2018 and July 2019. Notice that the median line was precise resistance in March. That action suggests that changes in price direction will occur on the angle of the line from the 2013 low.


