Market Update – July 28
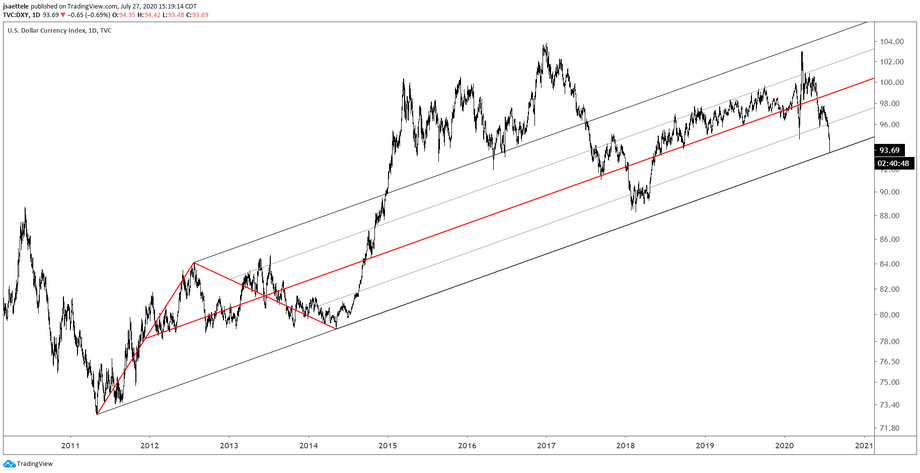
So much for ‘extreme sentiment’ towards the USD. DXY dropped for a 7th straight day today. Price is now testing the trendline from the 2011 low. The lower parallel from the channel off of the March high is slightly lower…about 93.15 (see below). At this point, I’m not sure where the next level of interest is if DXY fails to hold.
DXY DAILY

EURUSD DAILY

EURUSD is fast approaching the top of the channel from the 2008 high. The level is bolstered by the 61.8% retrace of the decline from the 2018 high and highs from September and June 2018 at 1.1823/52. Big level so maybe EURUSD stops going up everyday. Also, daily RSI is above 81. The next 3 charts show previous instances of daily RSI above 81. Most of these extreme RSI readings led to either sideways trading or formation of a top.
EURUSD DAILY

EURUSD DAILY

EURUSD DAILY

USDJPY 4 HOUR

USDJPY continues to respect levels within the channel from the March high. Today’s low is in on the 75 line. A bounce back into the center line would present a short opportunity near 106.16. The next downside level is the lower parallel near where the decline from March would consist of 2 equal legs at 104.12.
SILVER FUTURES DAILY

Pay attention to silver at 25.12-26.23. This is the September 2013 high, 2011 and 2012 support, and the 38.2% retrace of the decline from the 2011 high. If this freight train is going to stop for at least a short while, then this would be a good range to provide resistance. Also, daily RSI is above 84! Prior instances are shown with the next 2 charts (note that this is only since the inception of SLV). The only time that a reading this high didn’t mark an important top was in October 2010.
SLV DAILY

SLV DAILY


