Market Update 7/6 – Massive Crude Reversal
CRUDE OIL DAILY
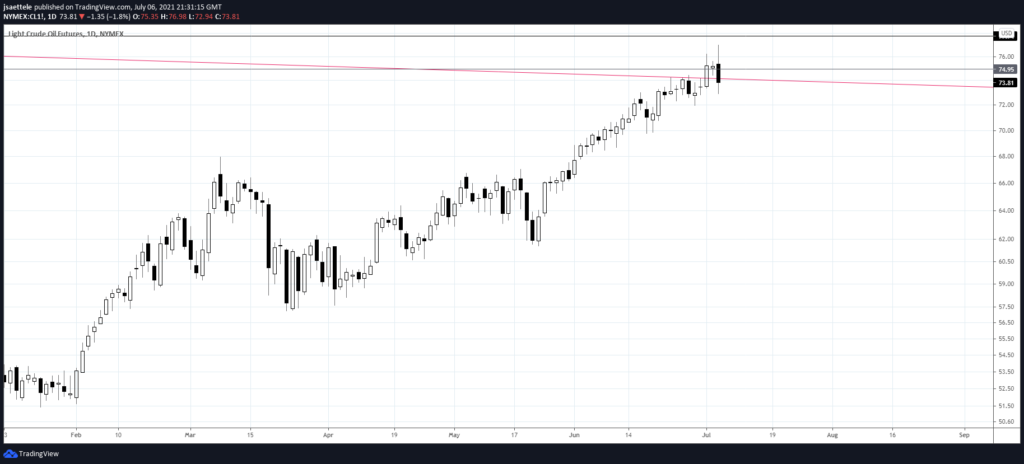
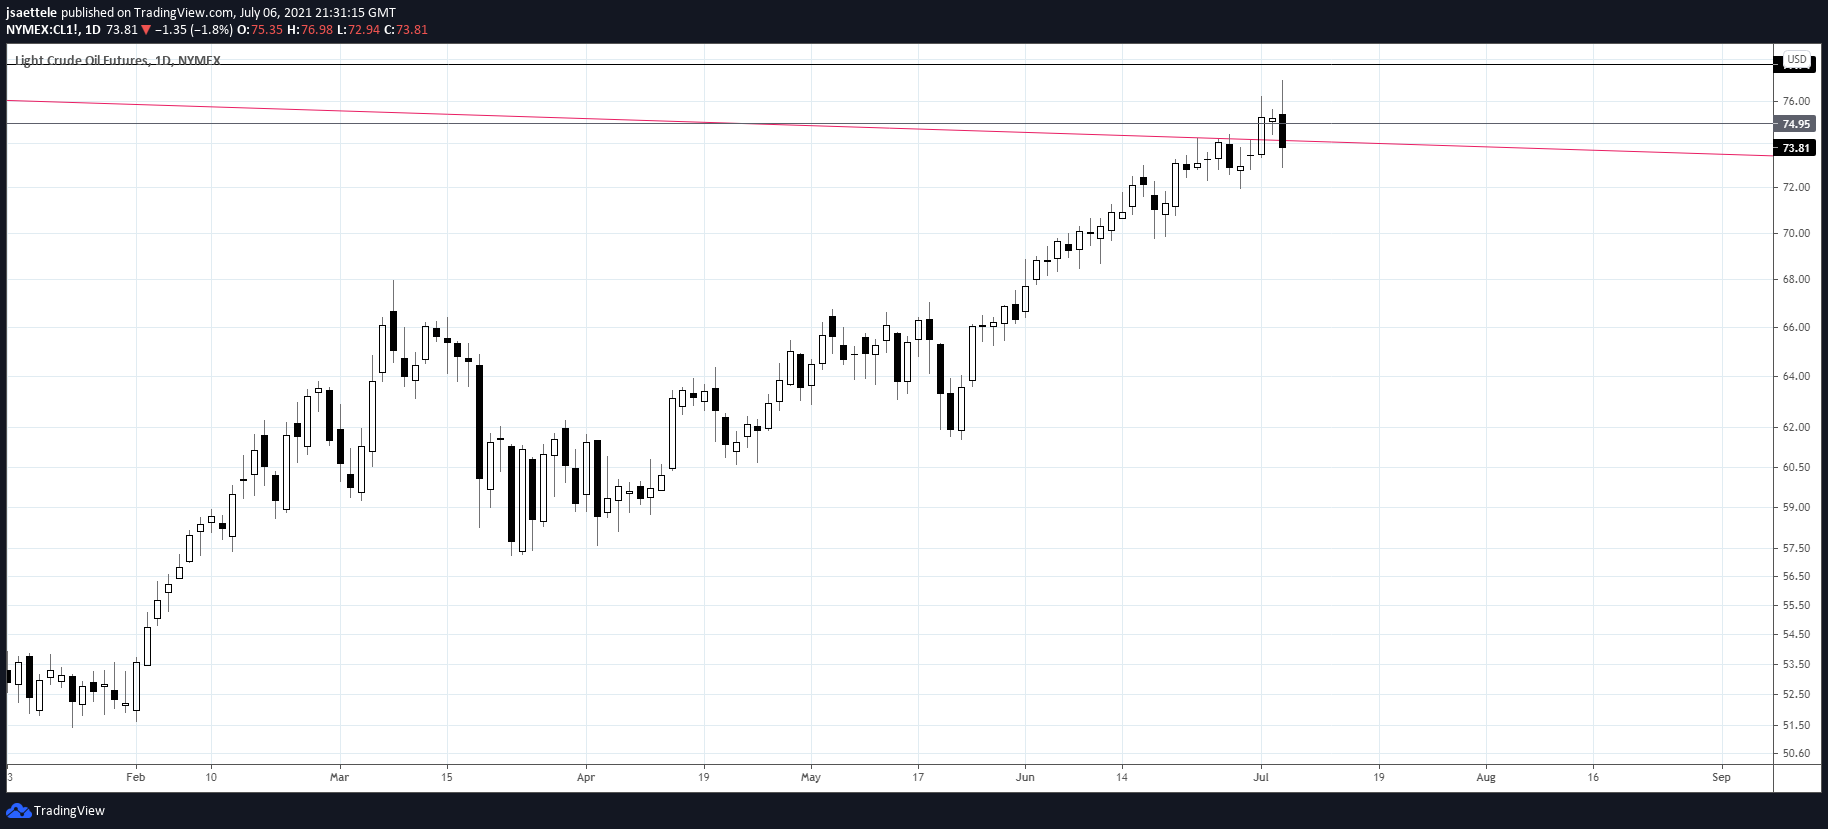
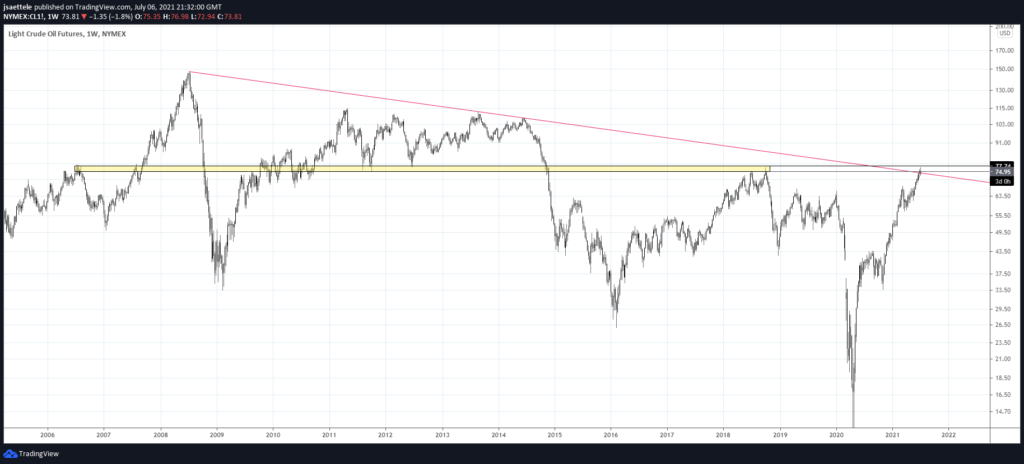
Crude put in a massive reversal today. I love the ‘top on news (OPEC)’ dynamic, especially from this major price zone. Recall that this is the trendline from 2008 and a well-defined horizontal zone (see weekly chart below). I am bearish crude at this level.
6/28 – Crude has reached the line that extends off of the 2008, 2013, and 2014 highs. HUGE LEVEL! Price reversed sharply lower today (outside bearish day in fact) and I think it’s worth taking a bearish stance against the high.
CRUDE OIL WEEKLY
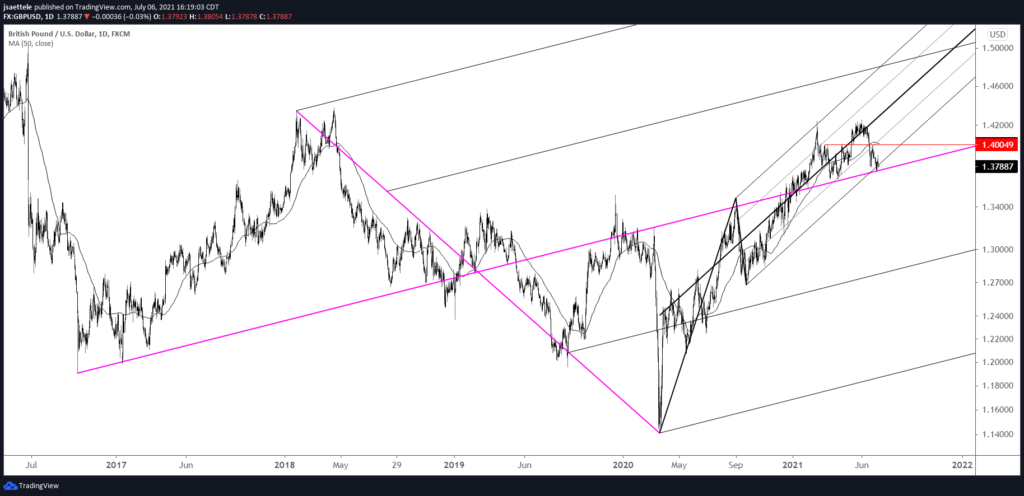
GBPUSD 4 HOUR
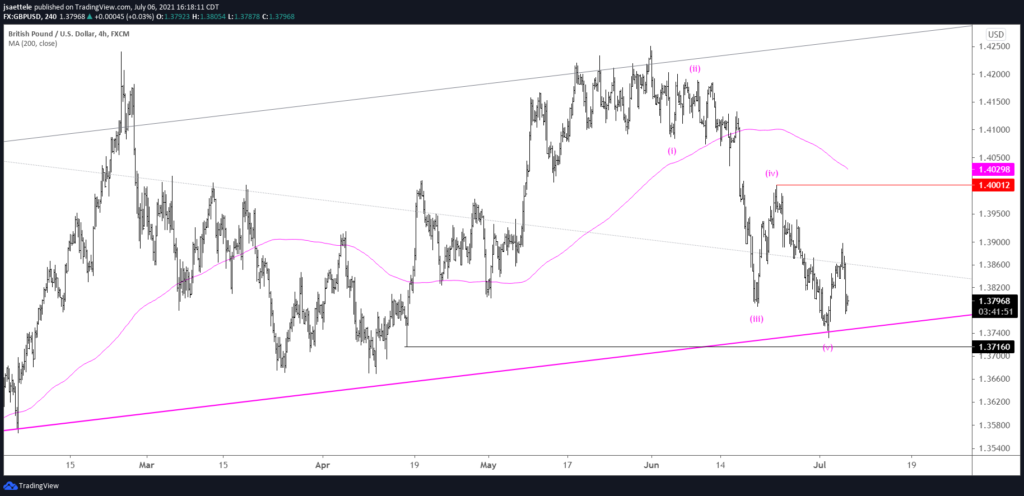
Cable nailed support and reversed higher after NFP last week. Support is well-defined from multiple forks (see below) and the decline counts in 5 waves. Today’s pullback may compose wave B of a 3 wave rally. I am looking higher as long as price is above last week’s low. 1.4000 is proposed resistance.
7/1 – GBPUSD hit the bearish target today. Given that the USDOLLAR level is slightly higher, I’m thinking that GBPUSD drops a bit more. 1.3715 is key. That’s the 4/16 low and where the decline from the top would subdivide into 61.8%. That is, wave 5 would equal 61.8% of waves 1-3. This is a common relationship.
GBPUSD DAILY
AUDUSD DAILY
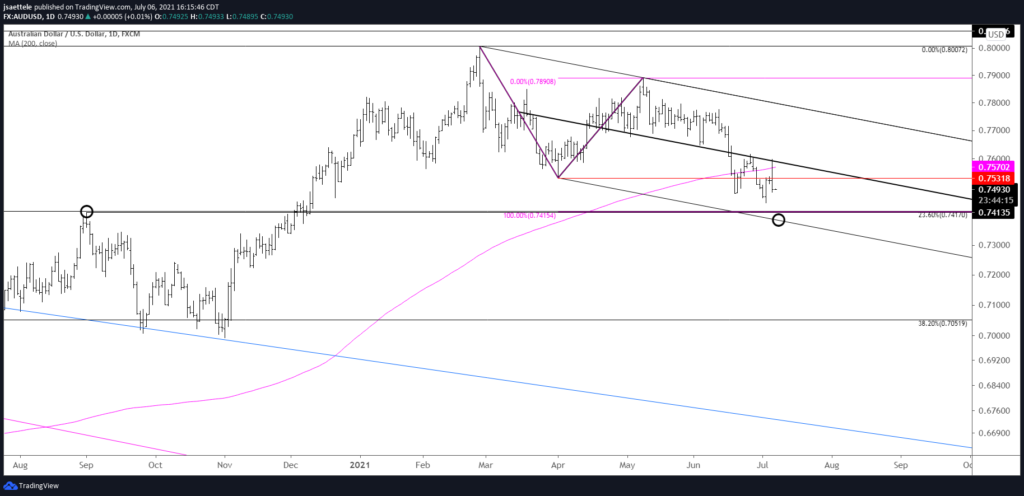
AUDUSD continues to respect levels within the channel from the February high perfectly. Today’s high was right at the median line (again). Downside focus remains .7415 or so. The lower channel line is slightly lower…currently about .7385. Resistance should be .7520/30.
6/29 – AUDUSD has spanned the channel from the 2011 high since the March 2020 low! Initial support is .7240 or so. Failure to hold there opens up the center line, which was previously resistance. That line isn’t until a .6600 handle.
USDCAD 4 HOUR
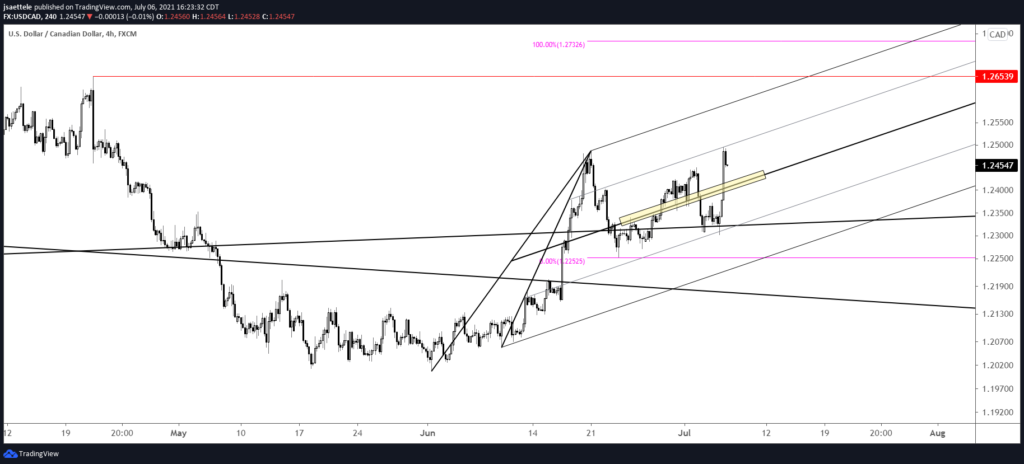
Notice how USDCAD is trading on parallels within the channel from the 6/1 low. Specifically, the 25 line has been support and the 75 line has been resistance. There are also reactions on the center line, which can be used for a long entry. That line is about 1.2410. Upside focus remains 1.2650-1.2720.
7/1 – USDCAD is pressing against trendline resistance, after breaking a longer term trendline (see below chart). Upside focus remains 1.2653-1.2721 but I’d LOVE a pullback here into 1.2340 or so given the specter of 5 waves up from the 6/23 low (see 2 charts down). If that pullback doesn’t materialize then a breakout entry will be in the cards. The chart above highlights a MONTHLY volume reversal for FXC. I’ve plotted USDCAD in blue since that’s what we’re trading. FX ETFs are terrible vehicles but they are useful to follow for volume signals (along with futures).
AUDJPY 4 HOUR
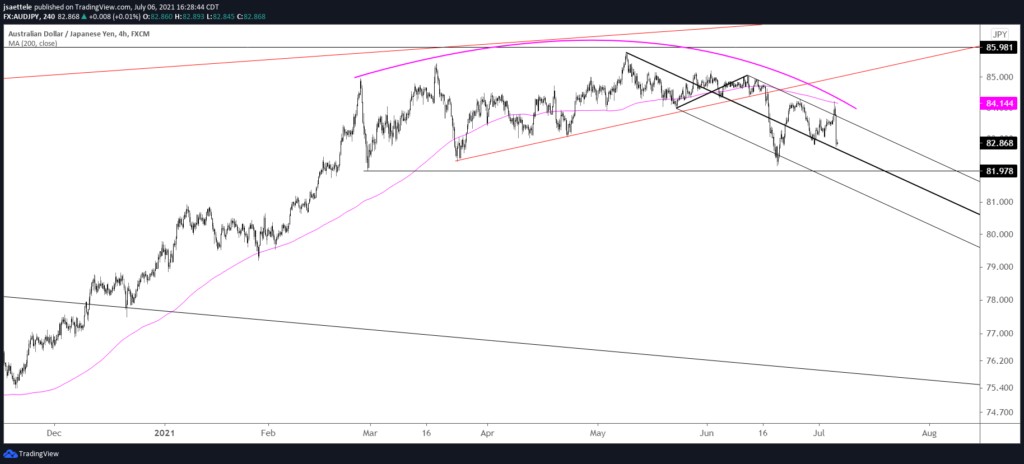
AUDJPY continues to respect the upper parallel of the fork from the May high. I also like that price reversed lower from the 200 period average on the 4 hour chart today. A head and shoulders top is evident with price action since February as well. The measured objective for the pattern (if confirmed) is 78.77. 83.30/50 is proposed resistance.

