Market Update 10/27 – BTCUSD Warning Equities?
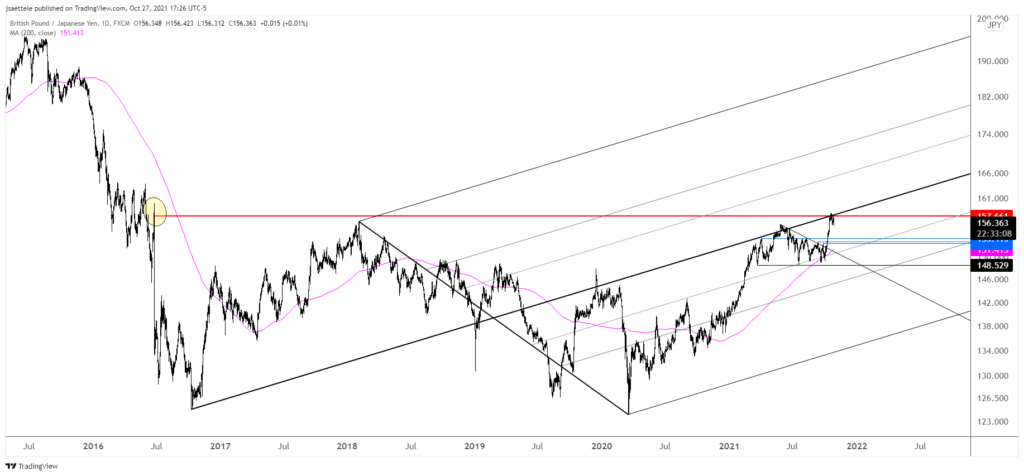
SPOT GOLD HOURLY
Gold continues to chop around proposed support (1790). I continue to look towards 1840 or so. In other words, my view hasn’t changed. I’m showing this chart today though in order to highlight the 200 hour average, which has been a superb trend filter for month. If gold is headed higher, then it’s headed higher from the current level (in my opinion).
10/25 – Gold broke above trendline resistance and the 200 day average today. The top side of the trendline (blue) is now proposed support near 1790. Upside focus is the line off of the August 2020 and June high. That’s about 1840.
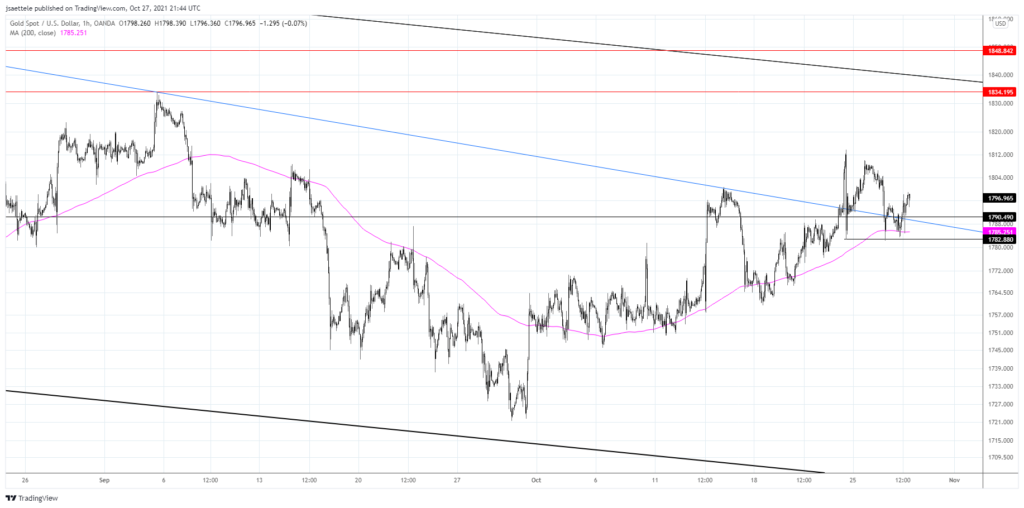
COPPER FUTURES (HG) 4 HOUR
Copper tanked again today and is fast approaching the key level noted last week, which is the top side of former trendline resistance. That line is about 4.33 now. A break below that line would start to suggest a double top with the May and October highs.
10/21 – Copper has pulled back (down over 4% today). The top side of recent trendline resistance is the key level to pay attention to for support. That is about 4.35 over the next few days. That level needs to hold in order to maintain a broader positive outlook on ‘Dr. Copper’.
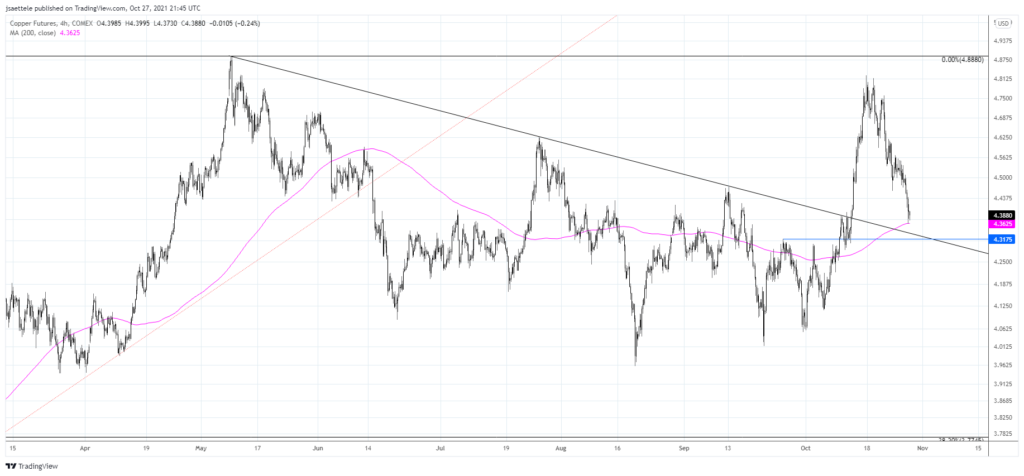
CRUDE OIL FUTURES (CL) 4 HOUR
Crude also traded sharply lower today. The lower channel line is now about 80.78, which is in line with the 10/20 and 10/21 lows. As long as that level holds, then it’s proper to maintain a constructive view. However, the bigger risk is lower given the recent euphoria regarding the energy rally. Watch for resistance near 84.
10/25 – Crude reversed lower today although requirements for a volume reversal were not met. As such, I’m not confident in fading this rally yet but be aware of a slope confluence near 86.75 for resistance. If price does trade lower from the current level then pay attention to channel support and the 20 day average, currently near 79.80, for support.
BTCUSD 4 HOUR
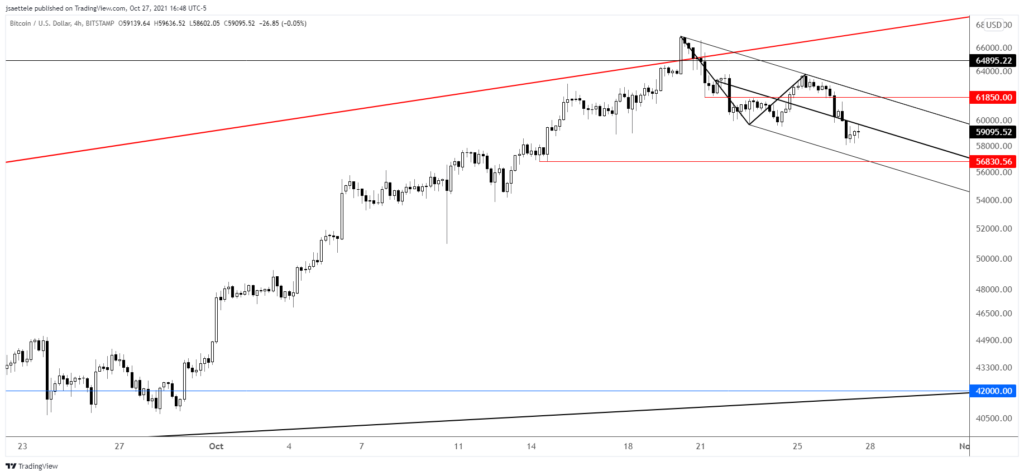
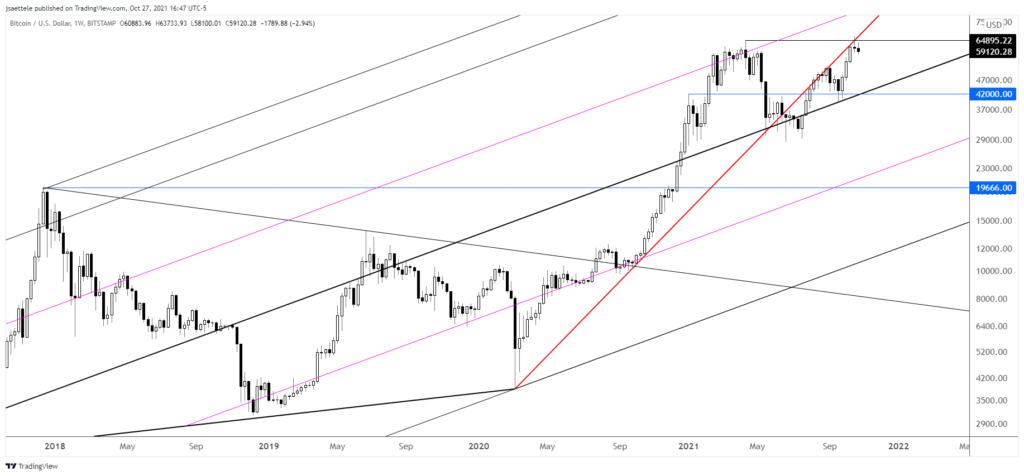
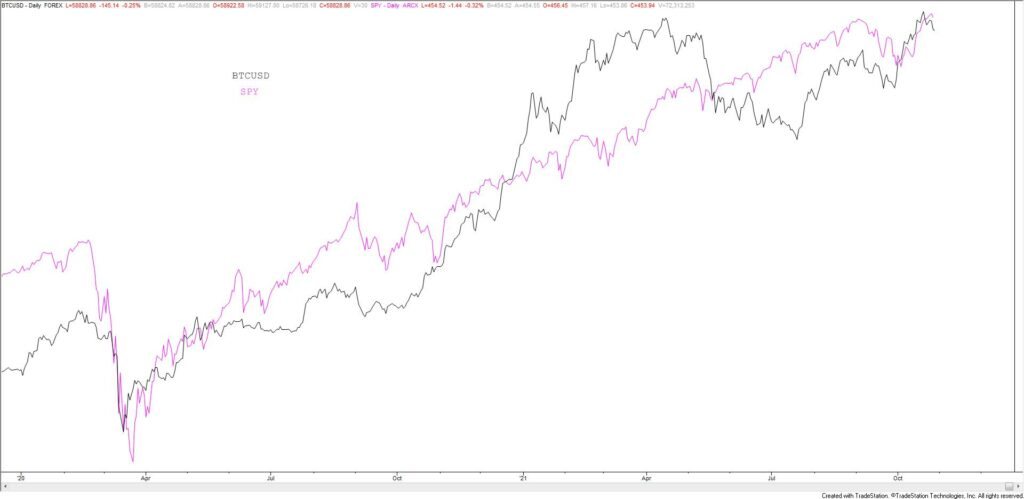
BTCUSD is off 13% since the top last week. If price drops under the short term lower channel line near 56830 then weakness will be considered impulsive and ‘waterfall’ weakness would be on the table. Watch for resistance near 61850. The weekly chart is shown below. This looks ‘toppy’ to me. Yes, ‘toppy’ is an official technical term. Former trendline support has provided resistance on the way up, a doji candle formed last week, and the rally failed after taking out the prior high. Seems bearish. Finally, is BTCUSD trying to tell equities something (see 2 charts down).
BTCUSD WEEKLY
BTCUSD (BLACK) AND SPY (MAGENTA) DAILY
USDJPY 4 HOUR
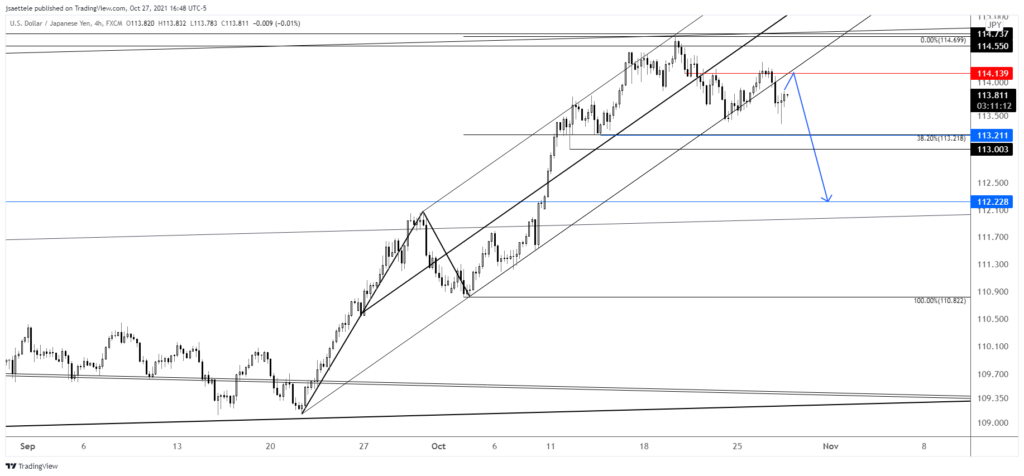
USDJPY broke the short term channel so I’m willing to trade from the short side. Proposed resistance is 114.14 so risk is tight. Downside focus is the 2020 high at 112.23 although 113.00/21 is a zone to note as well. BoJ is tonight.
10/25 – The break higher in gold is interesting when considering USDJPY. JPY and gold tend to trade together so perhaps last week’s reversal in USDJPY is ‘for real’ (see weekly chart below). Price is sitting on short term channel support right now. If price breaks below, then I’ll look to short a bounce into the underside of that line. For now, possible short term pivots are 114.20 and 113.20.
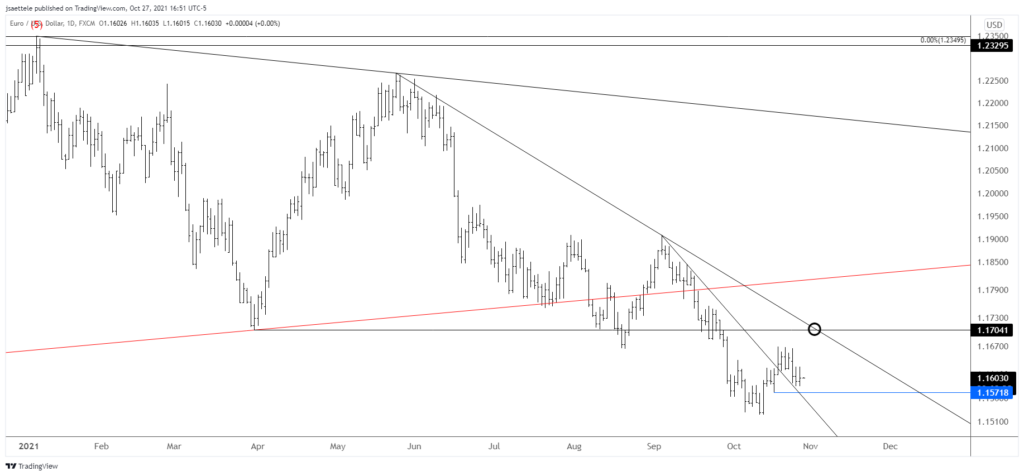
EURUSD 4 HOUR
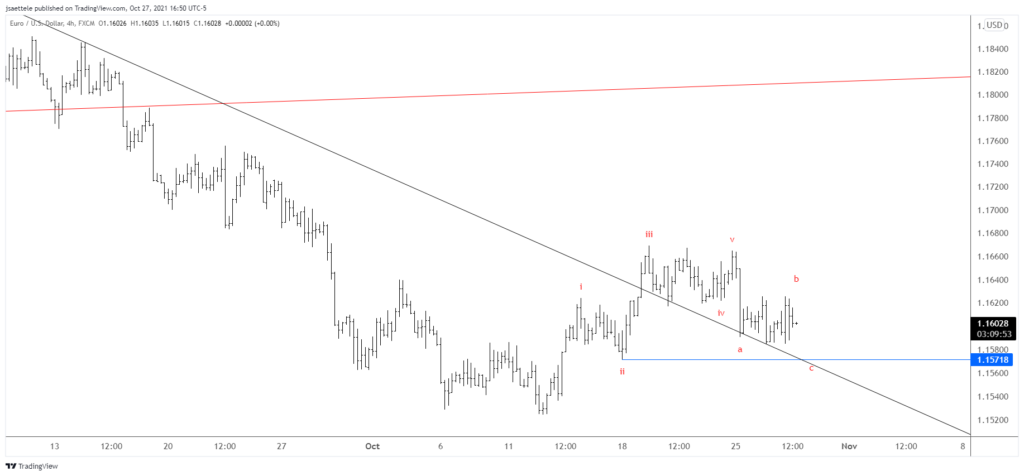
No change to EURUSD as the near term wave count continues to play out. Again, I’m looking for a higher low near 1.1570. This could of course happen in spike fashion with ECB tomorrow. Initial upside focus is 1.1700/30. This is trendline resistance and the March low (see daily chart below).
10/25 – The EURUSD wave count is updated to reflect the wave 4 triangle. My thinking is that today’s drop is wave A within the A-B-C drop so watch for a wave B bounce into 1.1635 or so before a final C wave drop into 1.1570. This could happen later this week on ECB!
EURUSD DAILY
GBPUSD 4 HOUR
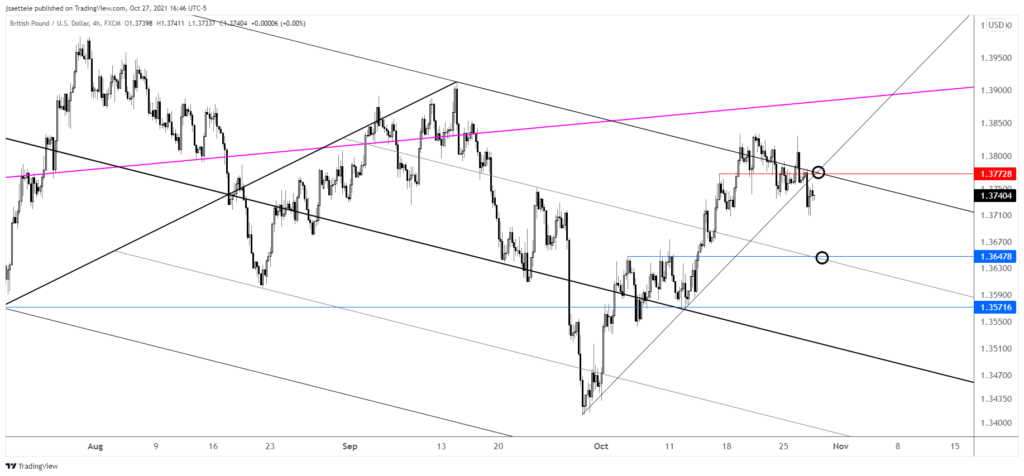
The short GBPUSD setup is valid following the drop under the short term support line. Proposed resistance is 1.3770s and the downside swing target is 1.3650. This is purely a levels play and don’t forget that VWAP resistance is above price along with the 200 day average. Finally, note that GBPJPY reversed lower from it’s pre-Brexit day close over 5 years ago (see below).
10/26 – Cable remains pinned at the top of the channel and just under the 200 day average and VWAP resistance (see 10/24 post). I ‘like’ shorting into resistance but price needs to drop under the short term support line in order to trigger. Hurry up and wait for now!
GBPJPY DAILY