Market Update 10/26 – USDCAD 4th Wave into BoC
Market Update 10/25 – Gold Breakout
October 26, 2021Market Update 10/27 – BTCUSD Warning Equities?
October 28, 2021
GBPUSD 4 HOUR
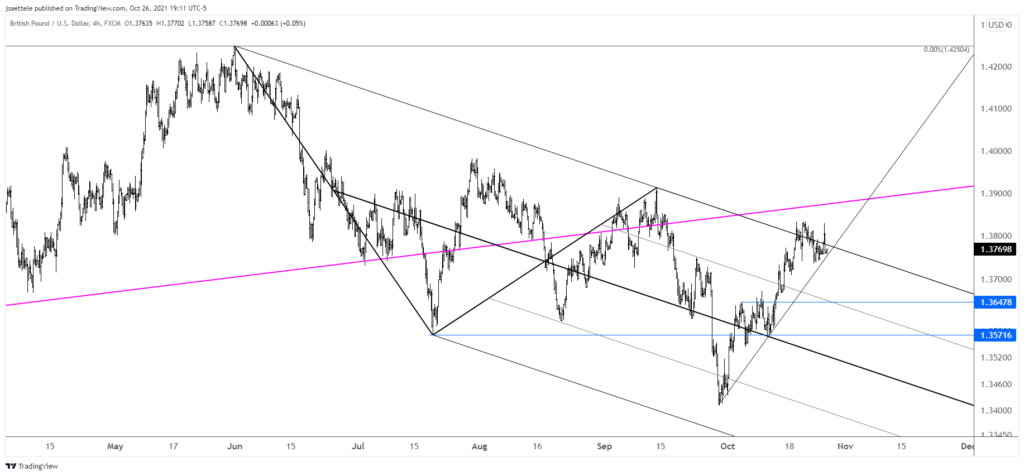
Cable remains pinned at the top of the channel and just under the 200 day average and VWAP resistance (see 10/24 post). I ‘like’ shorting into resistance but price needs to drop under the short term support line in order to trigger. Hurry up and wait for now!
10/24 – GBPUSD has rolled over from noted VWAP (see below) and channel resistance. As such, I lean towards additional weakness into 1.3650. This level is former resistance on both a horizontal basis and parallel basis (25 line of the channel). Similar to AUDUSD, if price does surge to a new high then it’s probably a 5th wave so be aware of the 200 day average near 1.3850.
AUDUSD DAILY
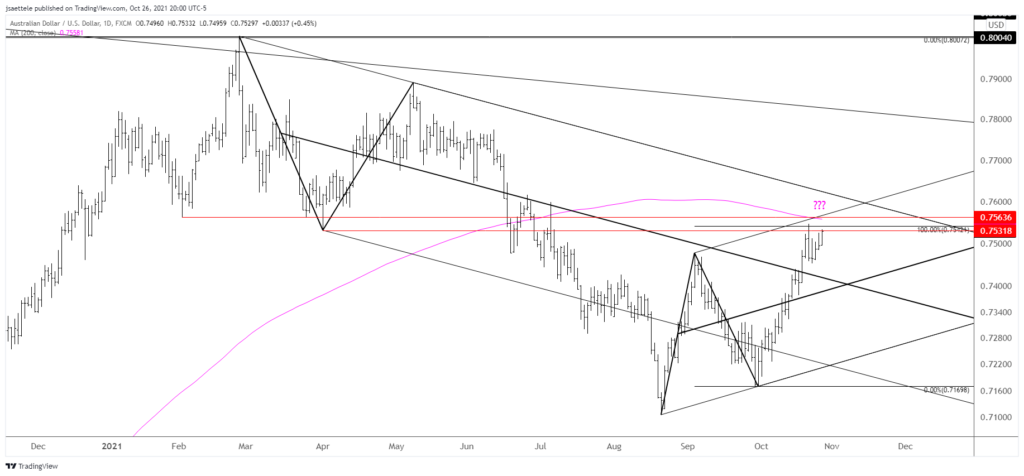
AUDUSD continues to drift sideways following the rally into 2 equal legs from the August low at .7542. Another push higher may be in store in order to tag the upper channel line near .7570. Note the February low at .7564 and 200 day average at .7558. Bottom line, I’m keen on the short side into in the event that Aussie tags and reacts near .7570 (or so).
USDCAD 4 HOUR
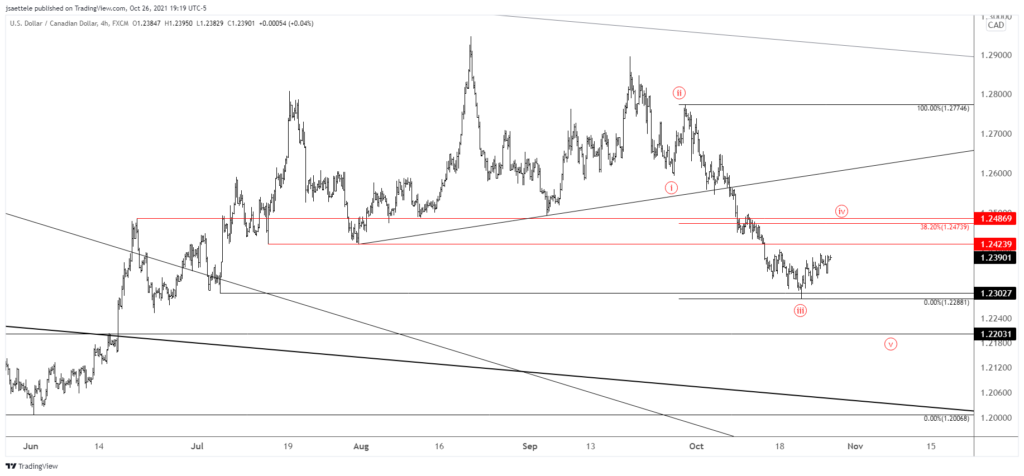
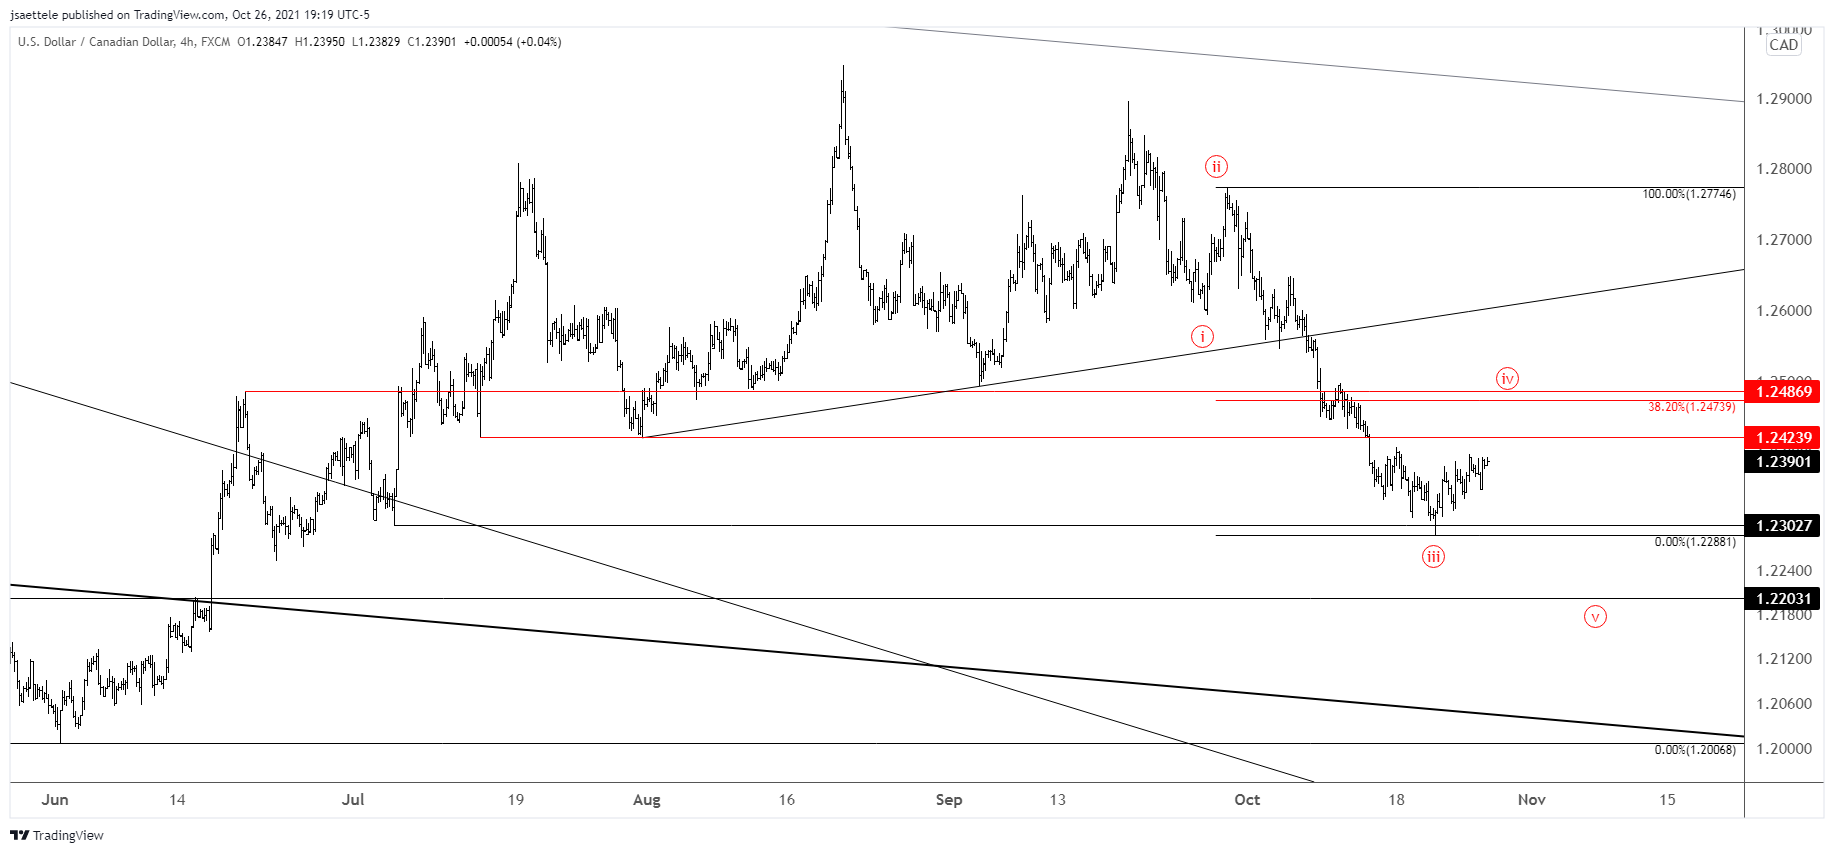
No change to USDCAD but I’m re-posting the chart because BoC is tomorrow. I continues to favor the scenario in which the bounce from 10/21 is a 4th wave. Ideal resistance is 1.2470/90 (38.2% retrace of well-defined pivot since June).
10/21 – USDCAD put in a bullish outside day today. I’m of the mind that today’s low marks the end of wave 3 within a 5 wave drop from the 9/20 high. Ideal resistance is 1.2473/94, which is the 38.2% retrace of proposed wave 3 and the September low.
USDCHF 4 HOUR
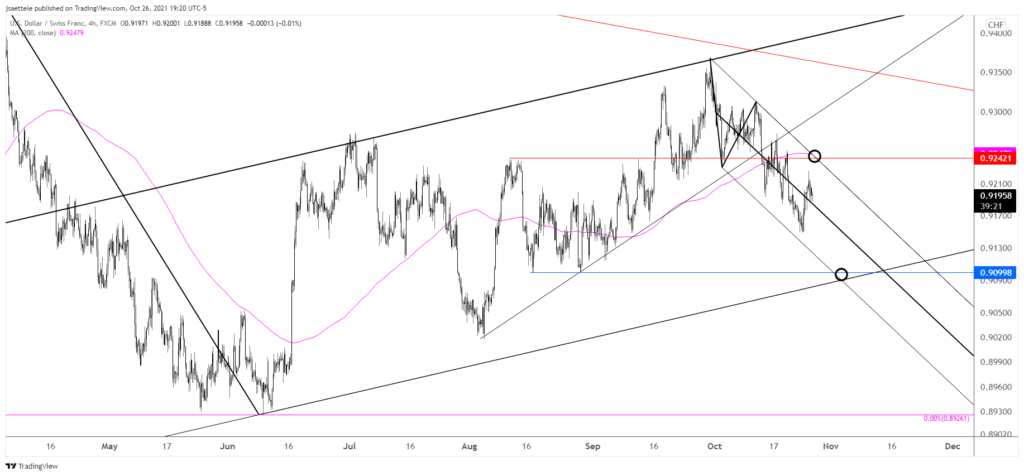
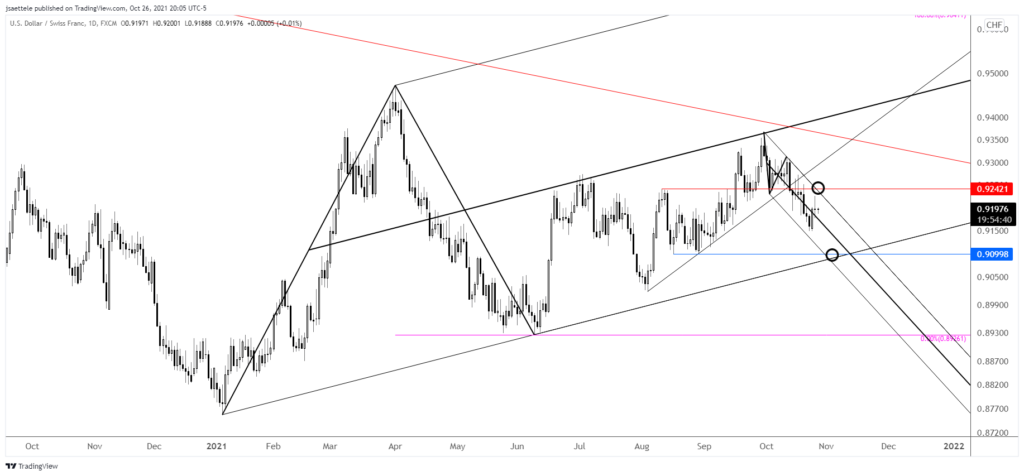
Near term USDCHF levels are well-defined for those wanting to play a range. Proposed resistance is .9240s but the more important spot to know is .9100, which is channel support and lows from mid-late August. The bottom of the channel is important because the July and September highs occurred on the channel center line (see the daily chart below).
USDCHF DAILY
USDTRY HOURLY
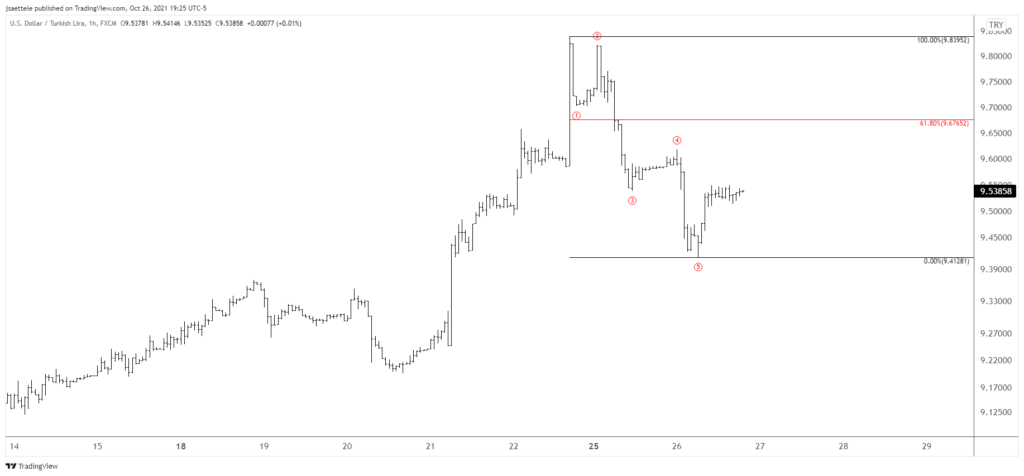
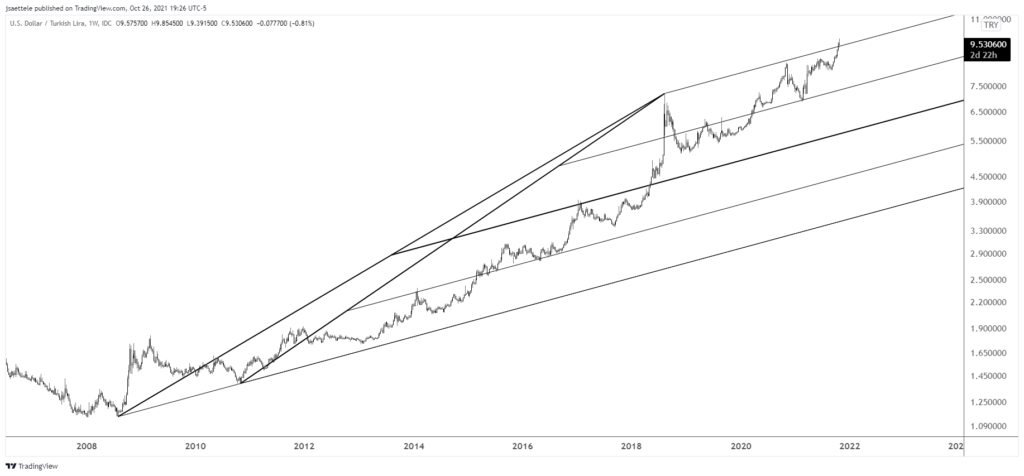
Is USDTRY a short? The decline from Monday’s high is in 5 waves so expectations are for corrective strength and a lower high. Proposed resistance is the 61.8% retrace at 9.6765. Bigger picture, it’s possible that that we just saw an overshoot of long term parallel resistance and therefore upside exhaustion (see weekly chart below).
USDTRY WEEKLY
