Market Update – July 16
EURUSD DAILY
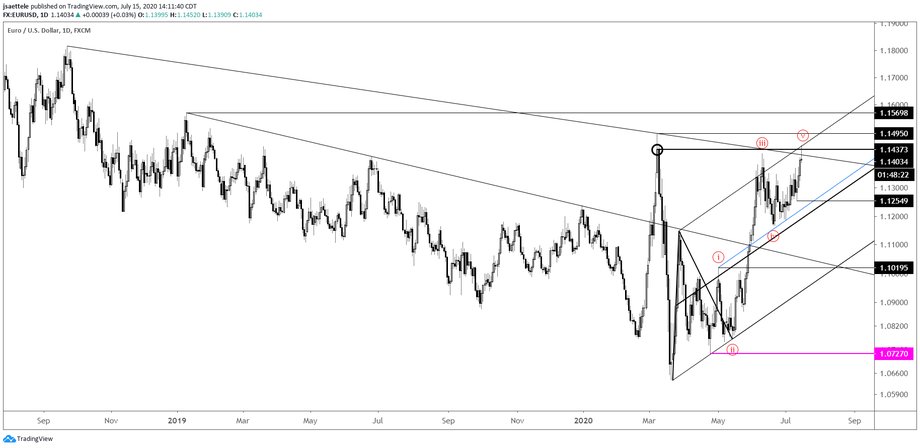
EURUSD traded 1.1452 today before reversing and closing near the low of the day. The high is right on the upper parallel of the channel from the March low. The line off of the September 2018 and March highs also reinforces the area as resistance. I’m of the mind that today was a high and now wish to trade from the short side. ECB is tomorrow. I’ll wait until that’s out of the way before determining entry.
7/14 – EURUSD is approaching the June high in what I’m viewing as a 5th wave. In other words, I’m on reversal alert with each tick higher. Pay attention to the noted 1.1460.
AUDUSD 4 HOUR

AUDUSD took out the 7/9 high and once again tested the December high and year open price (daily chart is below with year open plotted). The red line on this chart is the ‘breakdown’ line near .6930. Futures made a 4 hour volume reversal today (see 2 and 3 charts down). This is only the fourth such reversal since 2018. Reversal in January 2019 and December 2019 were spot on. The reversal in May failed.
AUDUSD DAILY

AUSTRALIAN DOLLAR FUTURES 4 HOUR

AUSTRALIAN DOLLAR FUTURES 4 HOUR

COPPER WEEKLY

This is a massive level for copper. That simple. Price made a bearish engulfing pattern today and a long term trendline and major horizontal level. This combination makes me favor the downside. Near term, continue to be aware of the median line and lower parallel of the channel from the March low (see below). The center line is about 2.86 now and the lower parallel about 2.73.
7/13 – Copper nearly took out the 2019 high today before reversing lower. The reversal also occurred after price spiked above the trendline from 2011. High today is also on the upper parallel of the channel from the March low. The reaction from massive overhead resistance strongly suggests that a high of importance is in place. Pay attention to the parallels within the channel from the March low (see below). The center line is near 2.84 and the lower parallel is near 2.71.
COPPER HOURLY

USDCAD 4 HOUR

USDCAD tanked on BoC. Very short term focus is on where the decline from 6/26 would consist of 2 equal legs at 1.3422. Proposed resistance now is the high volume level from 7/9 at 1.3567. Pattern wise, there are several ways to interpret action since the June low. The rally into 6/26 is in 3 waves but the decline from that level could end up as a 3 wave drop as well within a larger corrective process. Even so, as long as price is within the bearish channel from the March high, the downside is favored.


