Market Update: February 3
CRUDE OIL DAILY
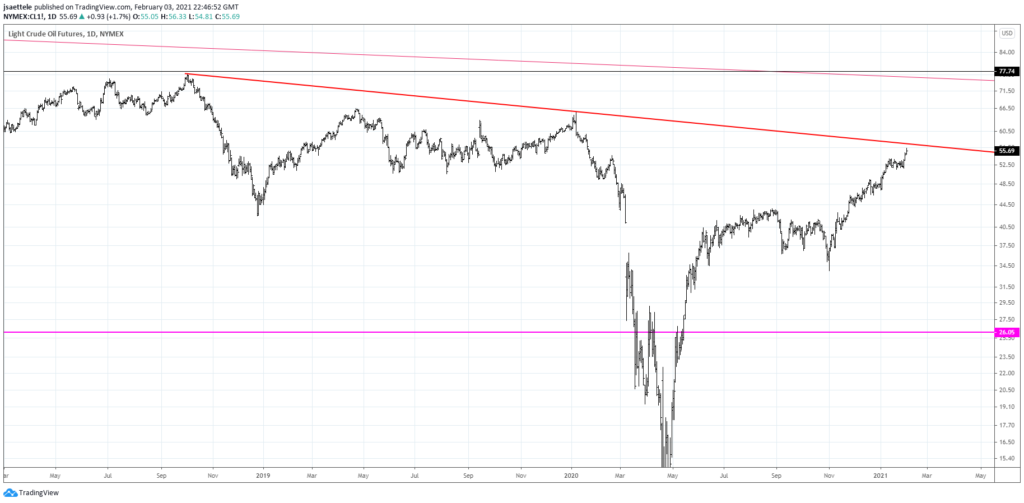
Pay attention to crude oil (WTI). Price is nearing the line that connects the 2018 and 2020 highs. The line is about 57.30. I’m on alert for reversal evidence.
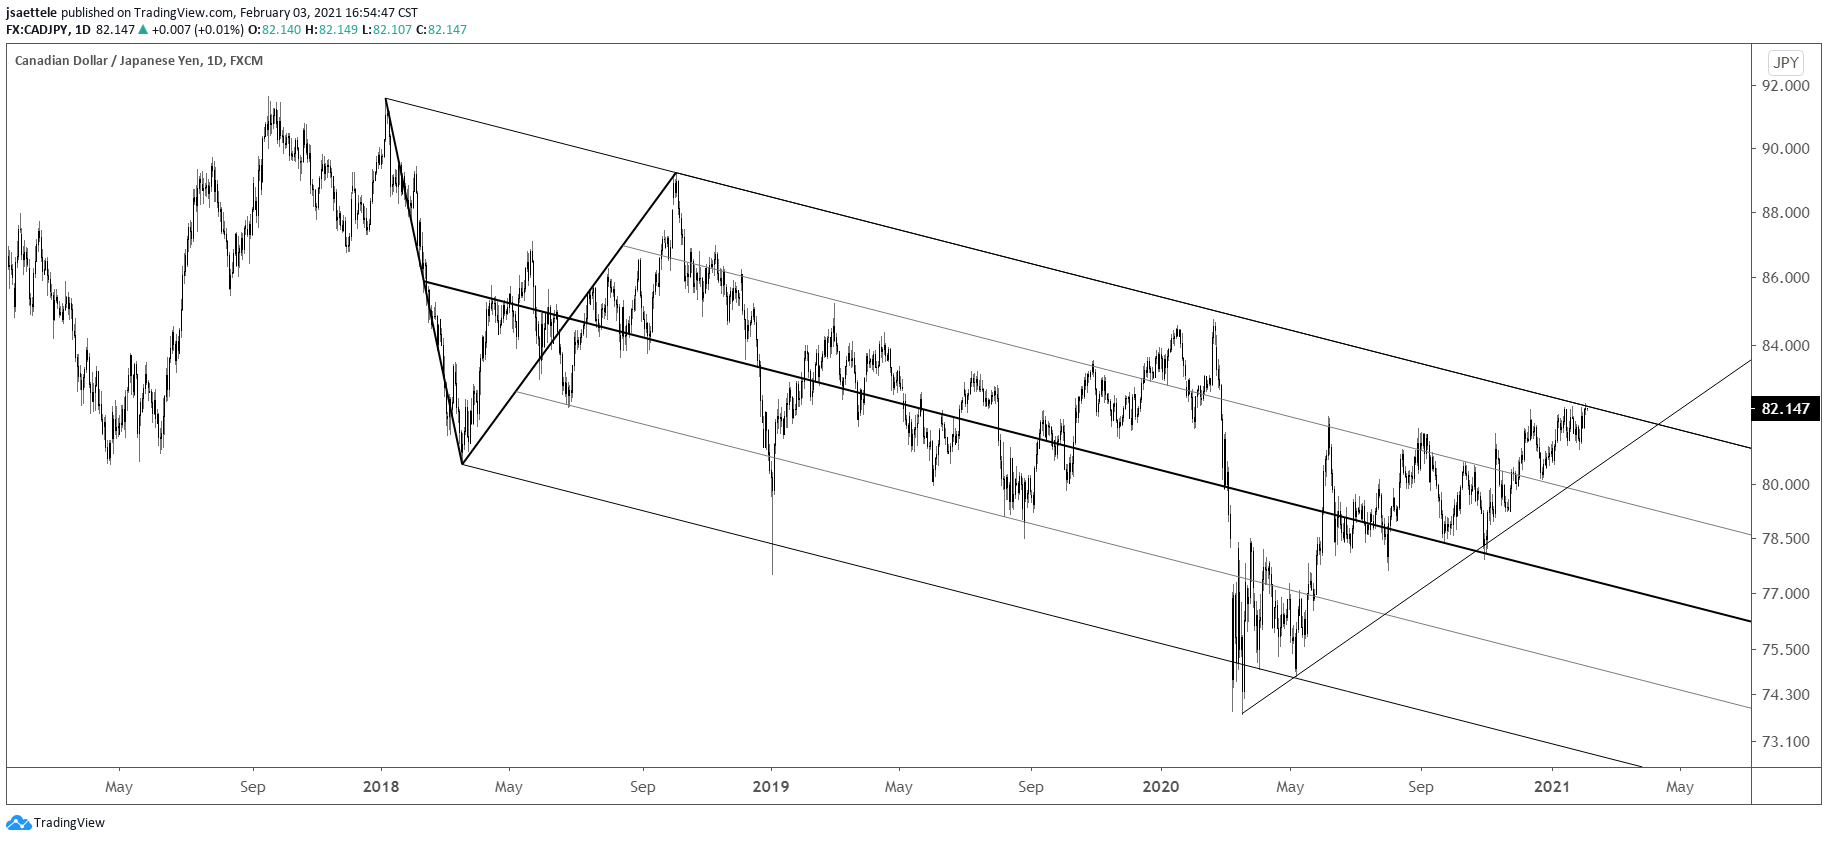
CADJPY DAILY

CADJPY is trading at the channel resistance that originates at the 2018 high. I’m ‘thinking’ lower from the current level but have no reason to enter yet. As noted in the previous chart, crude oil is nearing a potentially important inflection point. This is in interesting given the relationship with CADJPY (see below).
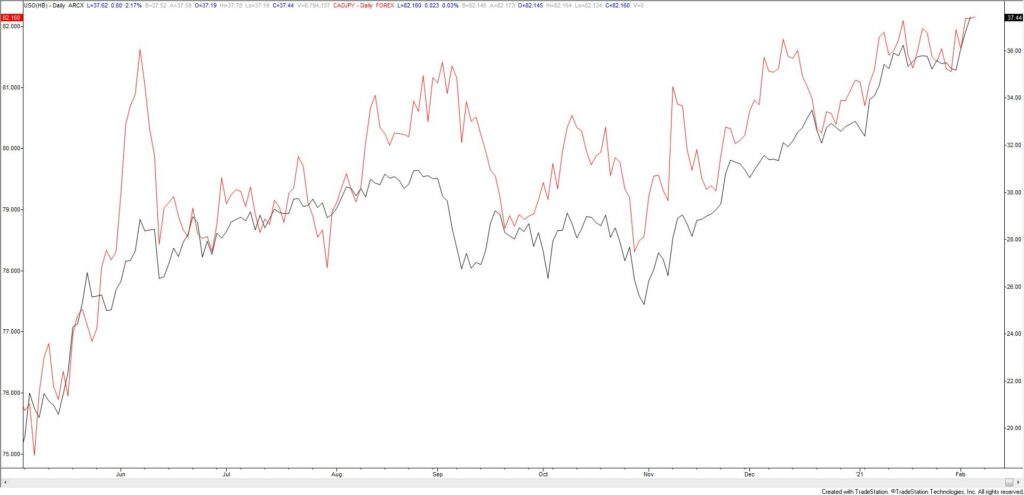
USO (CRUDE ETF – BLACK) AND CADJPY (RED) DAILY
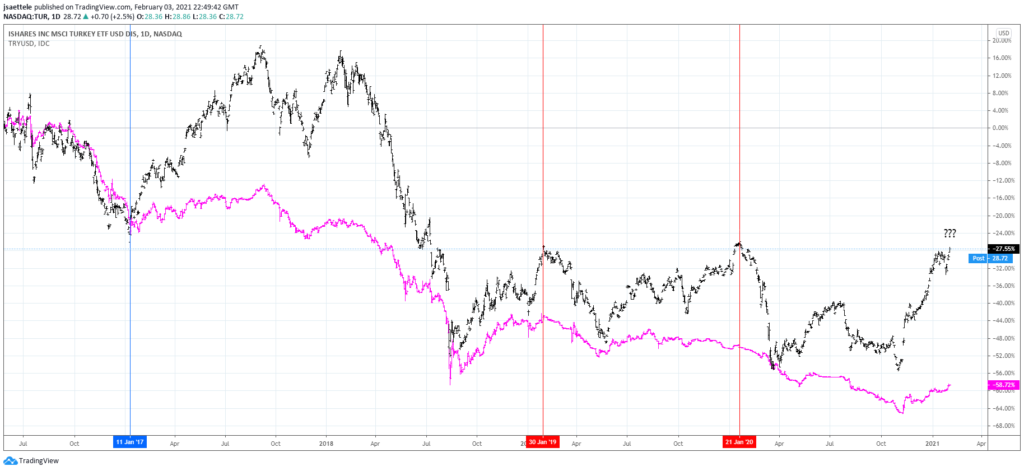
TUR (TURKEY EQUITY ETF) WEEKLY
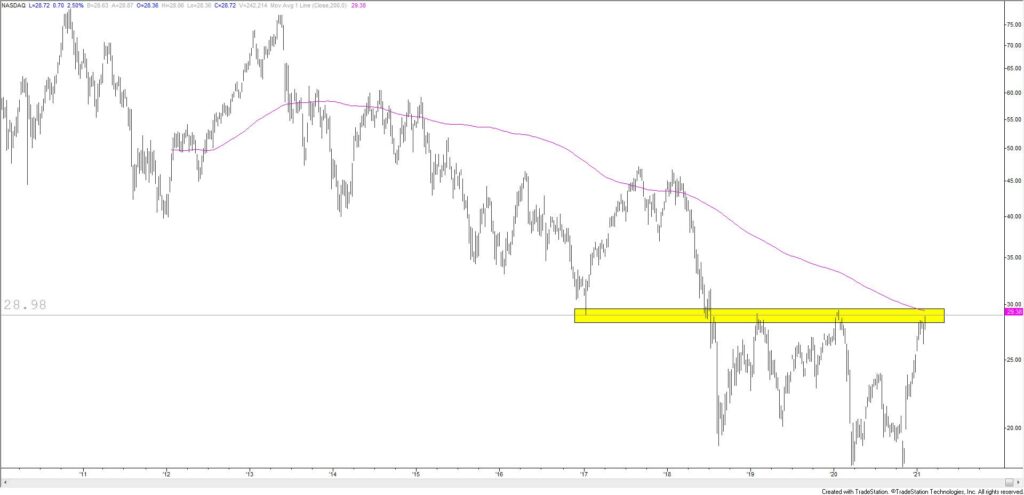
Recall the USDTRY chart yesterday, in which price has reached a well-defined level for support (TRY resistance). Well, TUR (Turkey equity ETF) is also at resistance from a major horizontal level and nearing the 200 week average. This is a major decision point for TUR and TRY. The chart below denotes with vertical lines the last 3 times that TUR was trading at this level (TRYUSD is in magneta).
2/2 – USDTRY reversed higher today following a tag of the line off of the November and January lows. The level is also defended by a parallel that relates to original slope. In this instance, original slope is the line that connects the 2008 and 2010 lows (see zoomed out chart below). Bottom line…a bounce here would ‘make sense’.
TUR (BLACK) AND TRYUSD (MAGENTA) DAILY
EURJPY DAILY
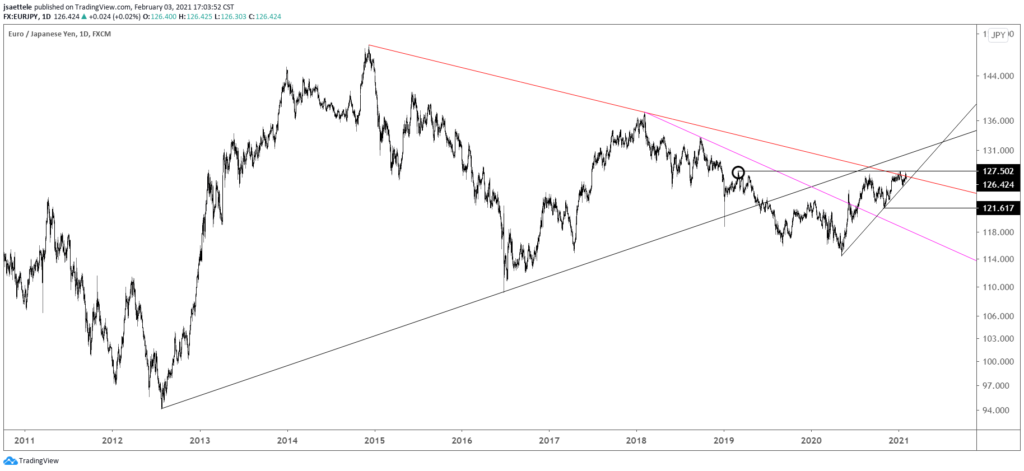
EURJPY has been trading at the line that extends off of the 2014 and 2018 highs for 6 weeks. In early January, price took out the 2019 high before turning down. I like the short side here but need a drop under trendline support, which is about 125.60, in order to trigger.


