
Market Update 6/16 – USD Time
USDOLLAR DAILY
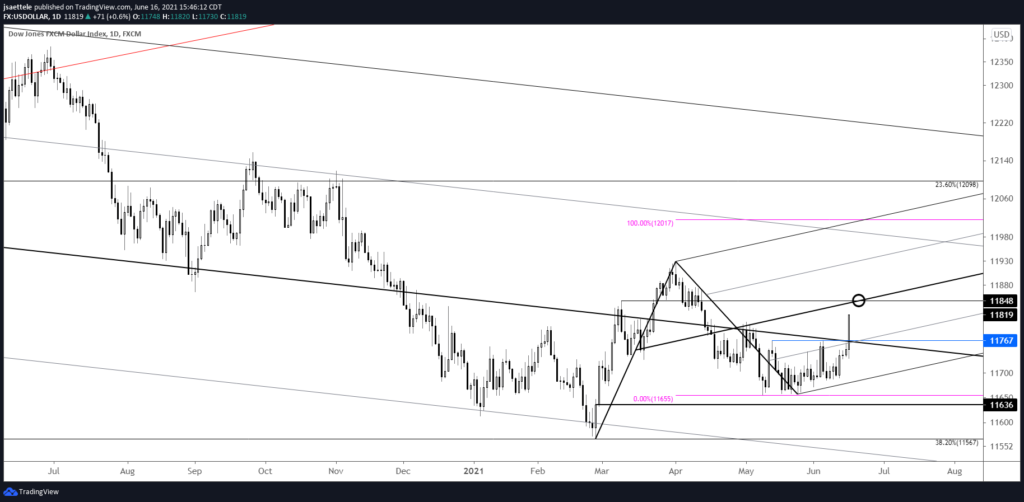
Today’s move in USDOLLAR proves us correct in the assertion that action since the beginning of the year is a bullish base. The top side of the median line is now support near 11767. A pullback is possible from the center line of the channel from the yearly low. That line is near 11848. Strategically, either wait for a pullback to 11767 or a break above 11848 (median line) and then look to buy a pullback into 11848 (or so).
6/14 – USDOLLAR is nearing (again!) the median line from the structure that originates at the 2017 high. A move above the line would represent an important behavior change and signal (finally!?) that price is about to burst higher from the base that began in January. Notice RSI on the 4 hour chart. 40 has been ‘support’ for the indicator and price tops have occurred when the indicator is ‘overbought’. This puts USDOLLAR in a ‘positive RSI profile’ on this time frame.
EURUSD 4 HOUR
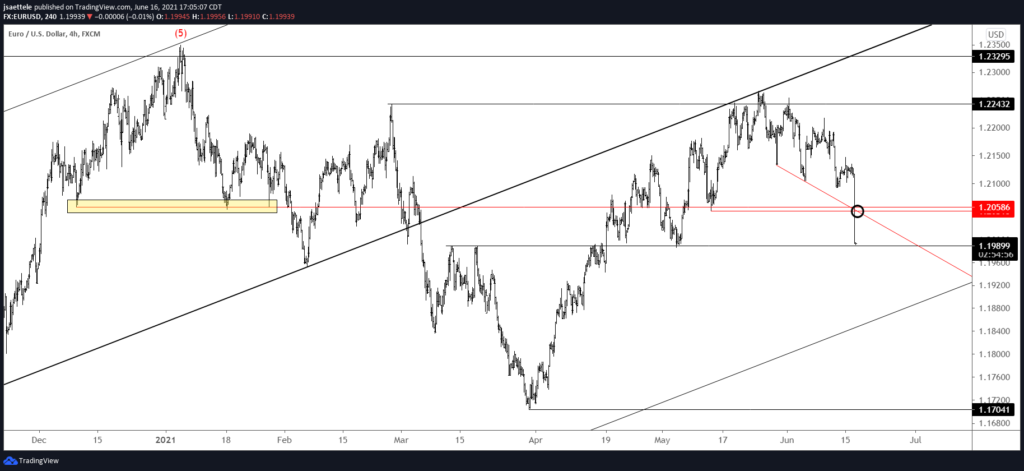
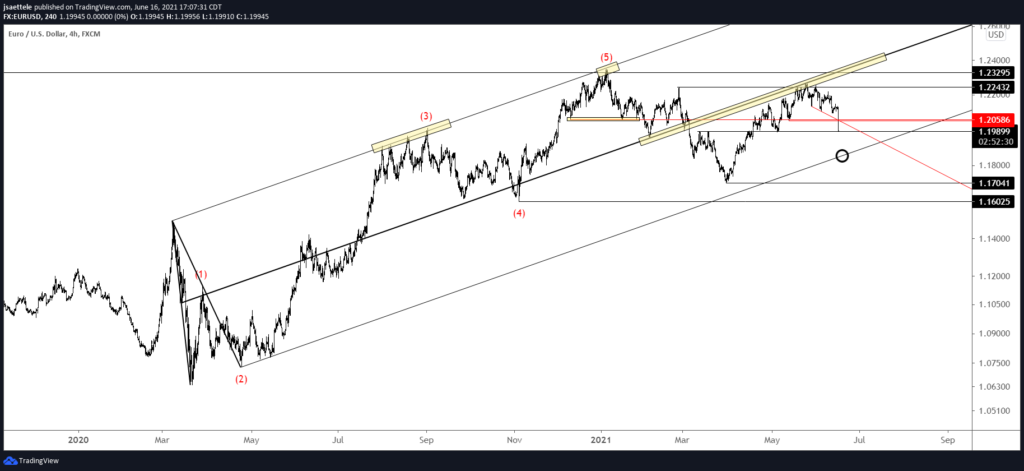
Here we are at 1.1990. If we bounce here then 1.2050/60 should provide resistance. Initial downside focus is the lower parallel from the channel that originates at the March 2020 low. That’s about 1.1850 (see the daily below).
6/3 – EURUSD has broken down and near term focus is 1.1990 (see highlighted zone). Resistance should be 1.2160. Eventual downside is the lower parallel of the channel that originates at the March 202o low. That line is about 1.1850.
EURUSD DAILY
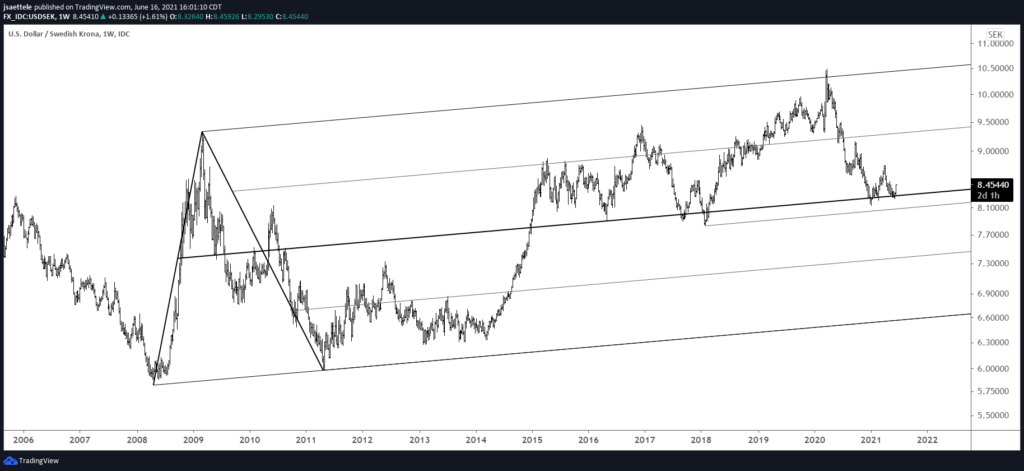
USDSEK DAILY
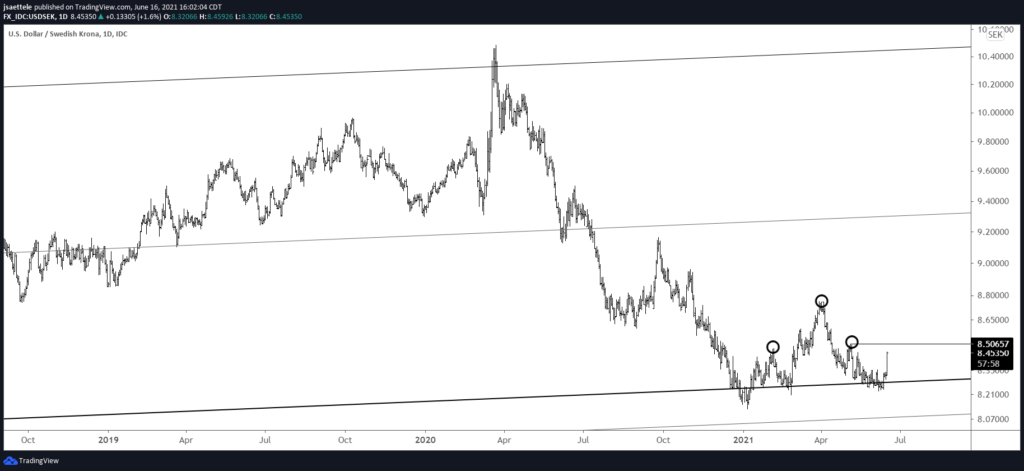
USDSEK may be about to complete a compound fulcrum pattern…from major support (see the weekly chart below). The pattern would complete on a rally above 8.5066. I know about this pattern due to Peter Brandt. The following text is from a May 2015 Peter Brandt post. I don’t know Peter personally but he is a legend in the world of futures/FX trading and I’ve learned a ton from his posts over the last 10+ years. His record speaks for itself.
The compound fulcrum is an extremely rare pattern. In fact, if a chartist diagnoses this pattern more than once every few years, then it is being overdiagnosed.
The compound fulcrum is always a bottom pattern — never a top. It occurs when a market forms a complex H&S top pattern after a prolonged and extended decline.
The key levels for confirming a compound fulcrum bottom would be a decisive close above the exiting right shoulder high…then a decisive close above the high of the head…
USDSEK WEEKLY
USDCNH WEEKLY
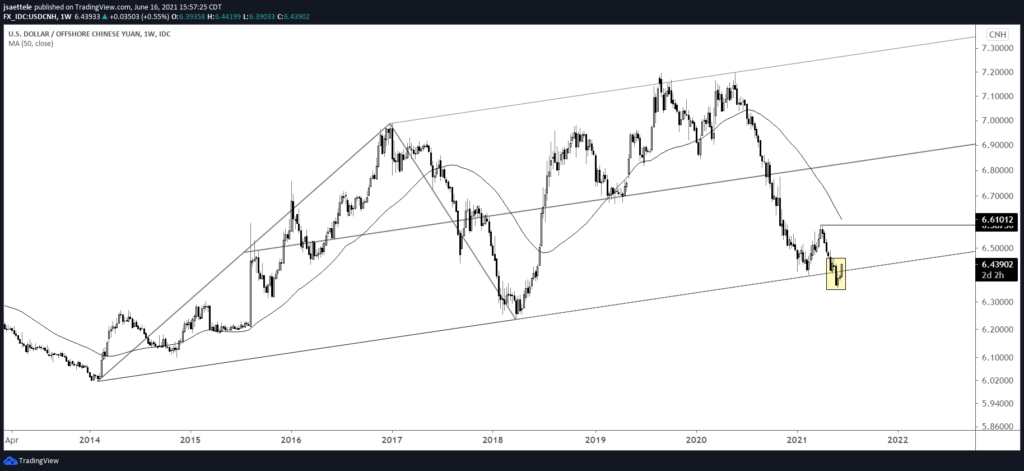
Remember when USDCNH broke a long term channel at the end of May? Today’s rally brings price back within the channel and leaves a massive failed breakdown. Failed moves tend to resolve with strong moves in the opposite direction…in this that’s higher. Take a look at the chart below. Bottom line, the failed breakdown in USDCNH is a USD bullish development.
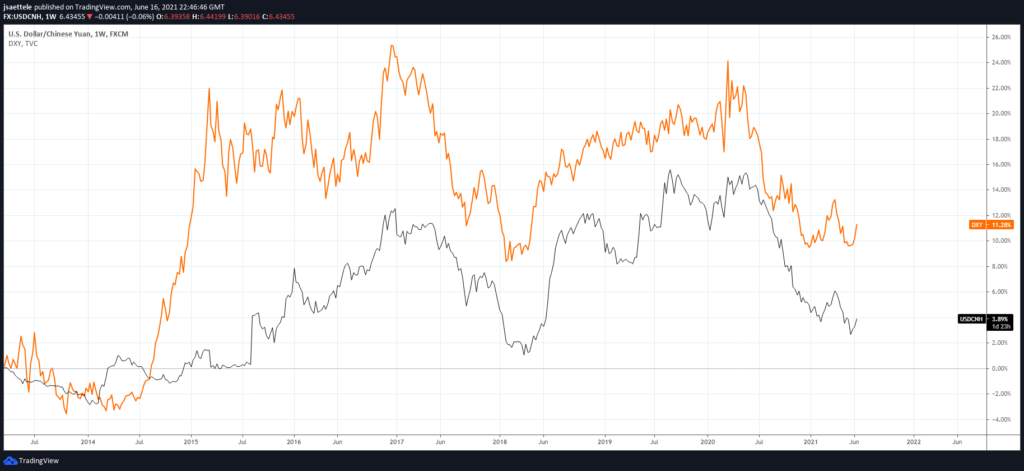
USDCNH (BLACK) AND DXY (DXY) WEEKLY
AUDUSD 4 HOUR
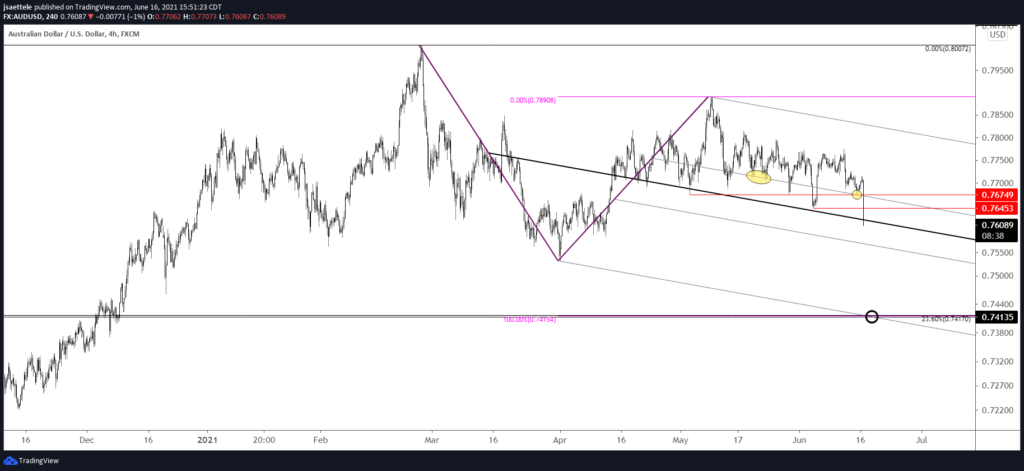
AUDUSD has dropped into the noted .7616. If price bounces (good spot for it), then resistance should be .7645/75. Downside focus remains the long cited .7415.
6/15 – AUDUSD put in a bearish outside day last Friday. Price hasn’t done much since, which is understandable with FOMC tomorrow. I’m ‘looking’ for a break but will note possible support at .7616 (daily reversal support). Proposed resistance is .7730s (50 day average, trendline, and month open).
NZDUSD DAILY
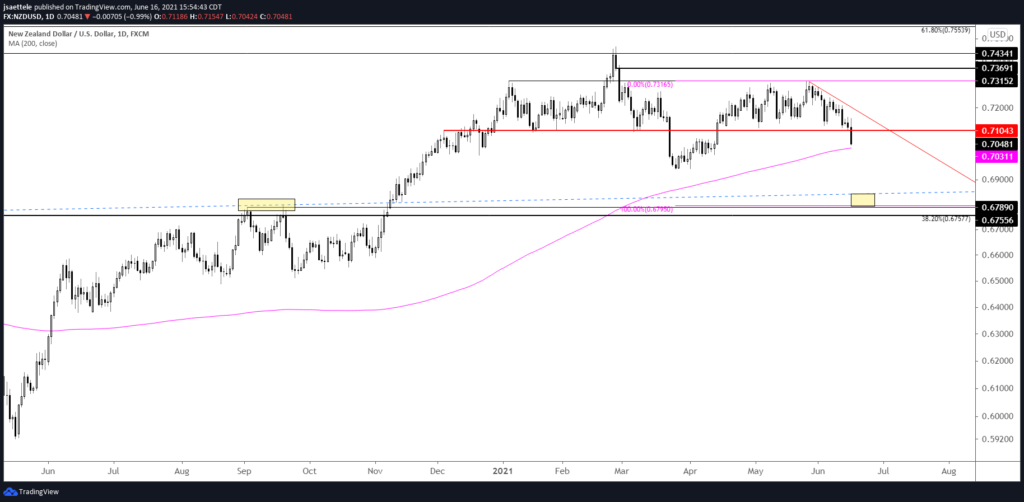
NZDUSD broke the ‘critical .7100‘! That is now proposed resistance and a level to increase size if reached. The 200 day average is a possible bounce spot at .7030 although broader focus remains .6750-.6800 (2 legs down from the high, 38.2% retrace from the 2020 low, and resistance from September).
6/15 – Kiwi is testing the critical .7100 figure. Similar to AUDUSD, the 50 day average is now proposed resistance along with a short term trendline near .7190 (which is also the year open).
USDCAD 4 HOUR
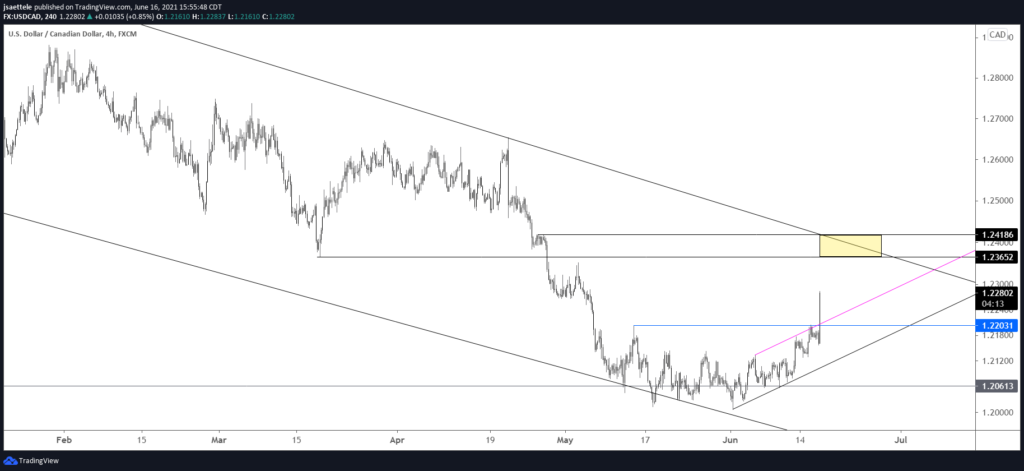
USDCAD confirmed a ‘slingshot’ setup today. That is, price broke above a bullish channel. The upper parallel from that channel is now proposed support near 1.2210. The next decision point is the trendline from April 2020. That line is about 1.2400 now but be aware of the March low at 1.2365.
6/14 – USDCAD has completed a bottoming pattern. Upside focus is the trendline from April 2020, which is in line with the March low at 1.2365 at the end of the month (see daily chart below). I’m bullish now as price is testing a short term neckline but 1.2100 is proposed support if the current level fails to hold.
AUDJPY 4 HOUR
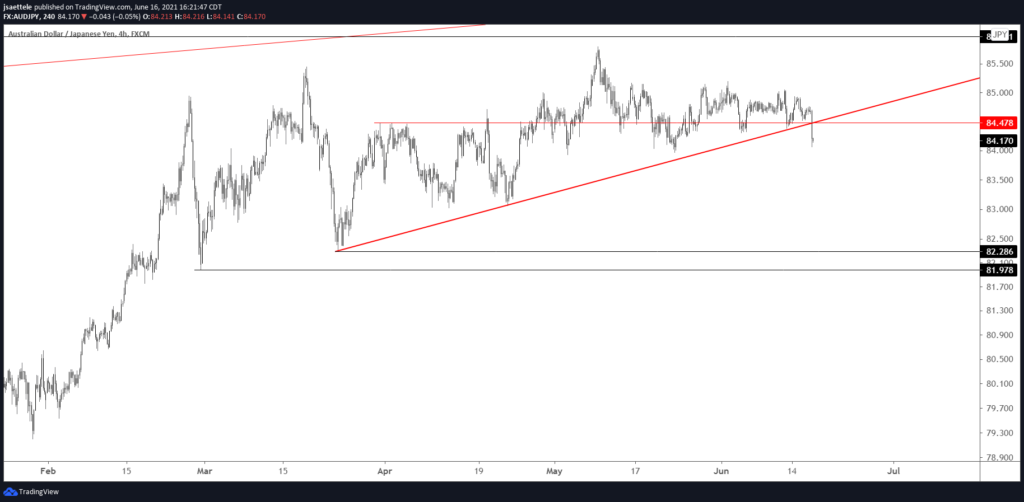
AUDJPY broke the trendline so I want to be short. The underside of the broken trendline is resistance to short near 84.50. Risk is tight above today’s high, which is defended by the month open at 84.75.
6/15 – No change to AUDJPY…price continues to press trendline support and the 50 day average. A break would warrant a short position with the 3/24 low at 82.29 as initial downside focus.


