
Market Update 6/15 – Copper Breakdown
COPPER FUTURES DAILY
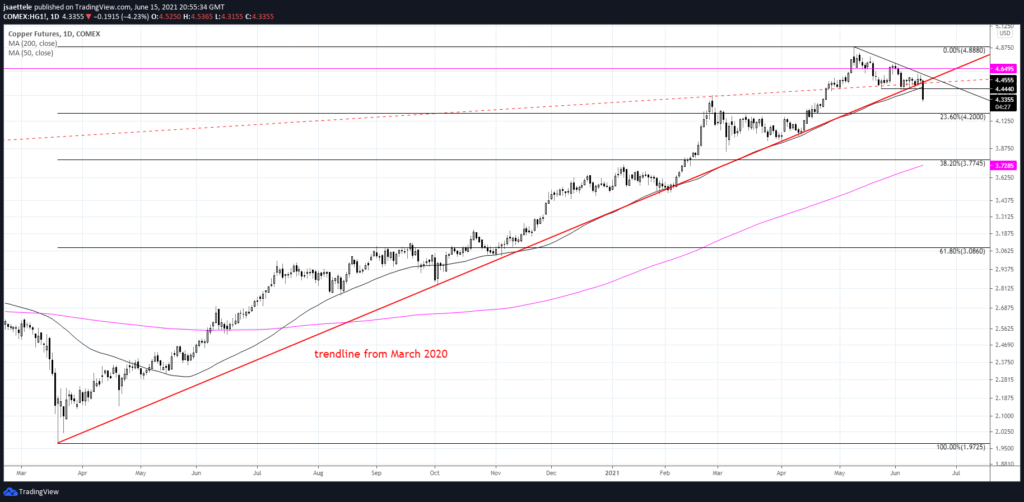
Copper broke today and the first level of interest on the downside is the 23.6% retrace of the rally from March 2020 at 4.20. This level coincides with resistance from this March. Former support at 4.4440 (also the 50 day average) is now proposed resistance.
6/10 – Here we are again in copper! 14+ month trendline support and the 50 day average are being put to the test. A break could lead to extended weakness. More importantly, a break would indicate a significant behavior change. Maybe that is what’s needed in order for markets to ‘wake up’ generally?
S&P 500 FUTURES (ES) DAILY
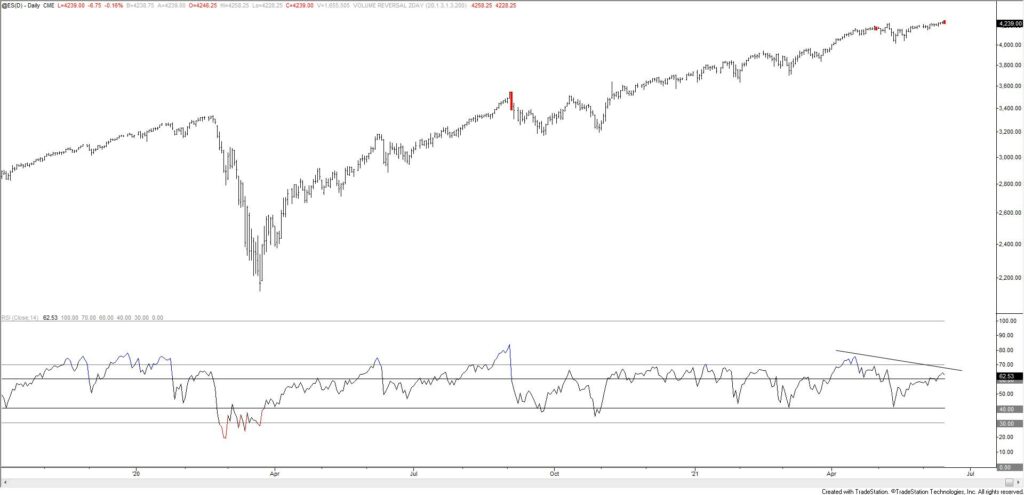
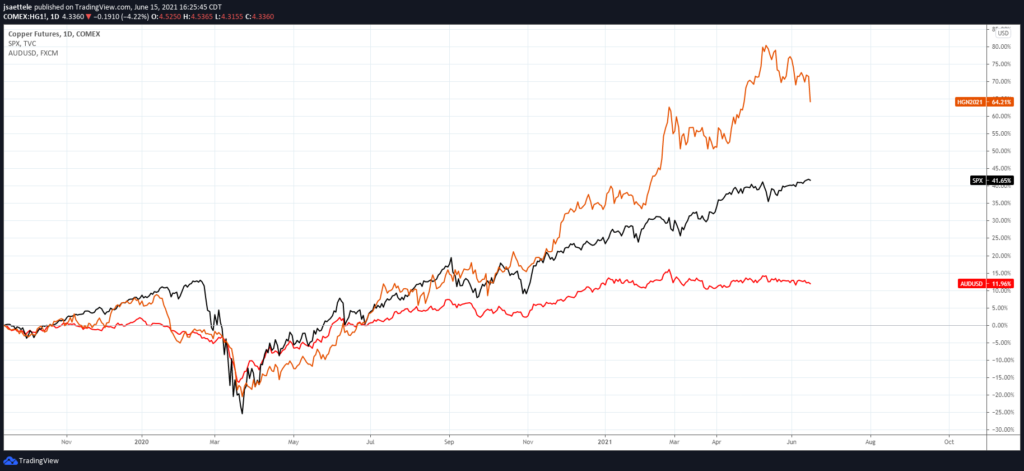
ES completed a 2 day volume reversal today (high volume rally followed immediately by a high volume decline). The red bars show 2 day volume reversals from 1 year highs. It’s interesting that this signal occurred on the same day as the copper break. The chart below plots copper, SPX, and AUDUSD. I’m wondering if FOMC is going to kick off a period of risk aversion.
COPPER (ORANGE), SPX (BLACK), AUDUSD (RED) DAILY
AUDUSD DAILY
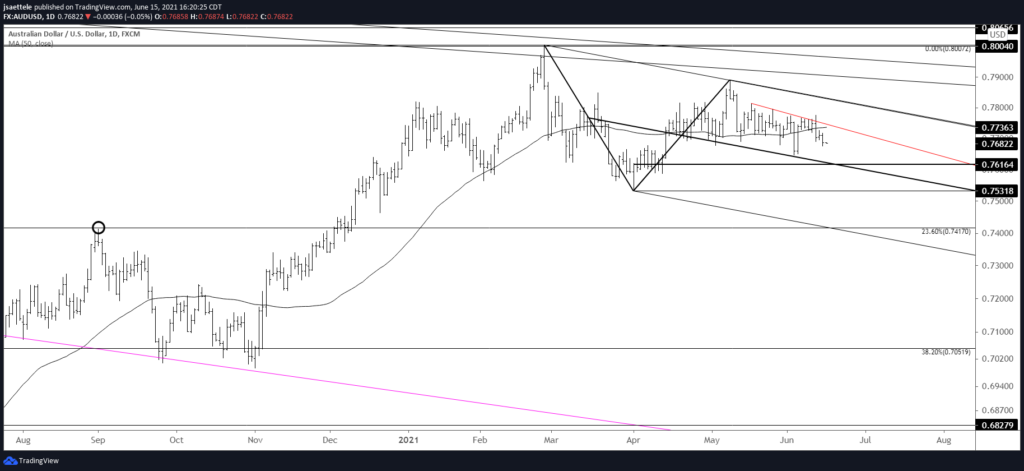
AUDUSD put in a bearish outside day last Friday. Price hasn’t done much since, which is understandable with FOMC tomorrow. I’m ‘looking’ for a break but will note possible support at .7616 (daily reversal support). Proposed resistance is .7730s (50 day average, trendline, and month open).
NZDUSD DAILY
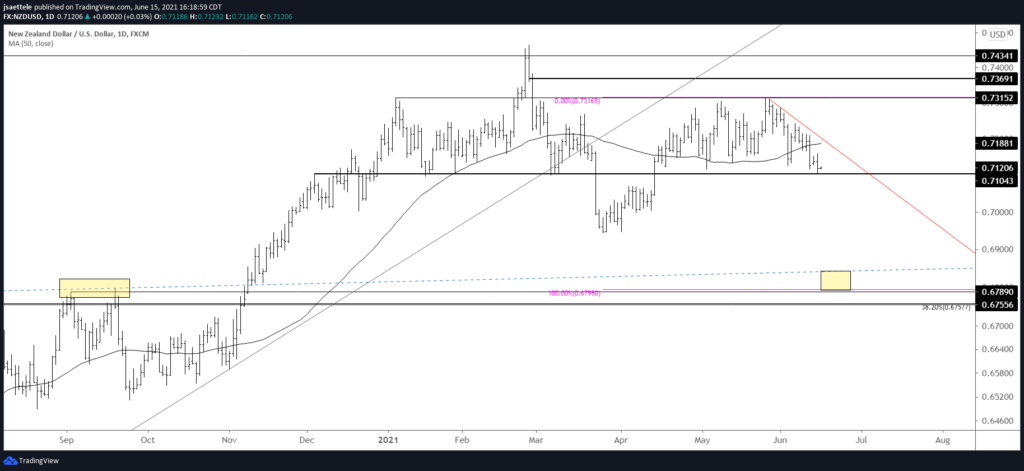
Kiwi is testing the critical .7100 figure. Similar to AUDUSD, the 50 day average is now proposed resistance along with a short term trendline near .7190 (which is also the year open).
6/3 – NZDUSD broke the trendline that originates at the March low today. The underside of that line is now proposed support at .7180. Downside focus is .6800…give or take a figure.
AUDJPY DAILY
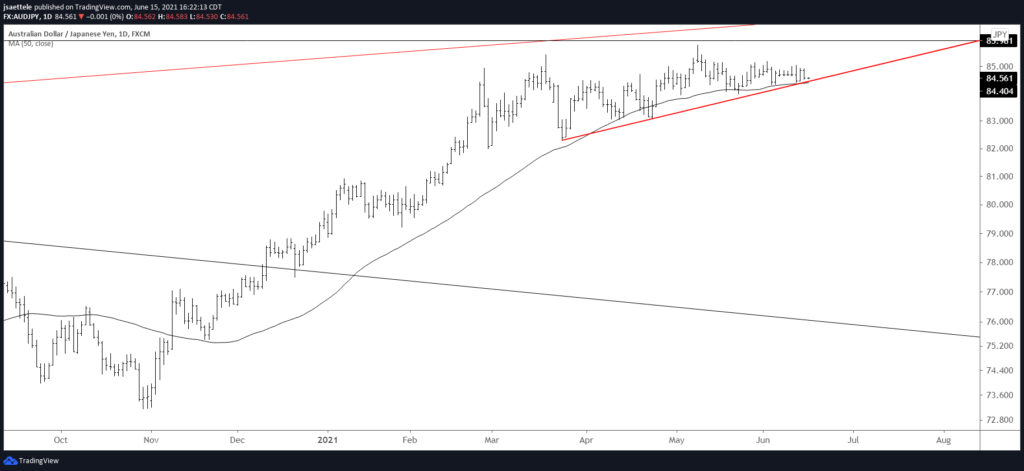
No change to AUDJPY…price continues to press trendline support and the 50 day average. A break would warrant a short position with the 3/24 low at 82.29 as initial downside focus.
6/9 – The indicator below AUDJPY is 20 day range size (percentage). The 20 day range has only been this small once…EVER. That reading was in July 2019…right before the bottom fell out of the cross. Complacency is EXTREME! The short trigger is the trendline from the 3/24 low….which is about 84.50.


