Market Update 11/30 – More USD Topping Evidence
CRUDE OIL FUTURES DAILY
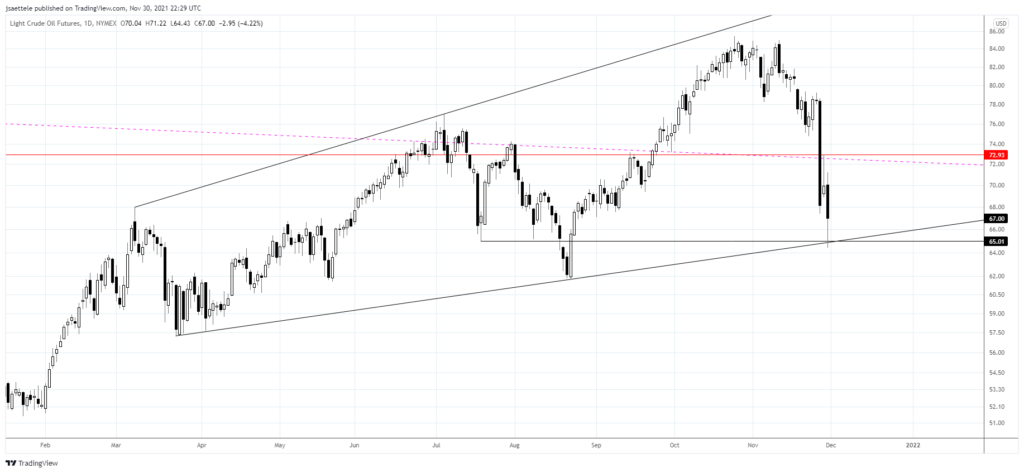
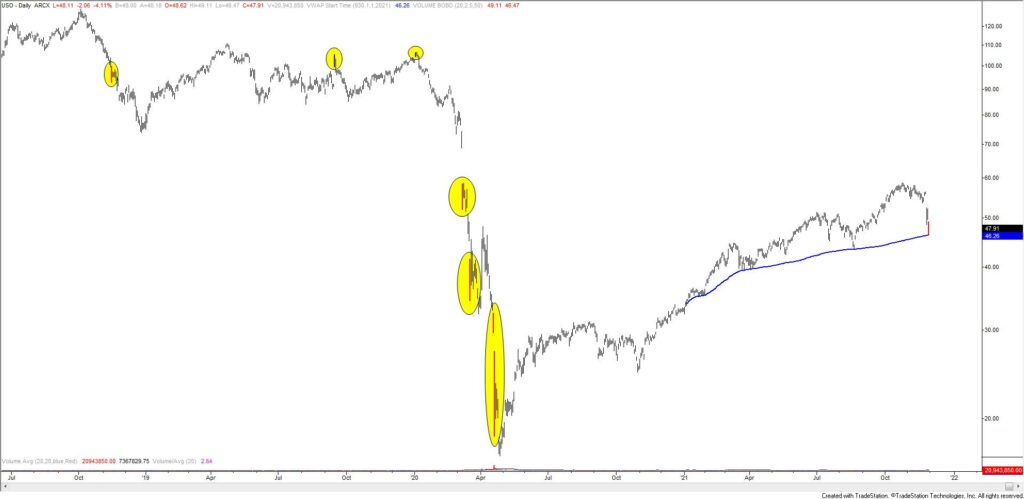
Crude entered ‘bear market territory’ today (20% drop). Interestingly, the low was at the line that extends off of the March and August lows. As such, I’m thinking bounce with resistance near 72.90. However, this level has to hold otherwise there is risk of additional free fall. I mention this because 2020 VWAP is also just under today’s low in USO (see below) and volume today was exceptionally high. The red/blue bars on the next chart denote 50 day lows/highs with volume at least 2.5x 20 day average volume. In recent years, volume of this magnitude on the downside has NOT marked lows. Rather, we tend to get a violent bounce followed by additional weakness.
USO DAILY
DXY 4 HOUR
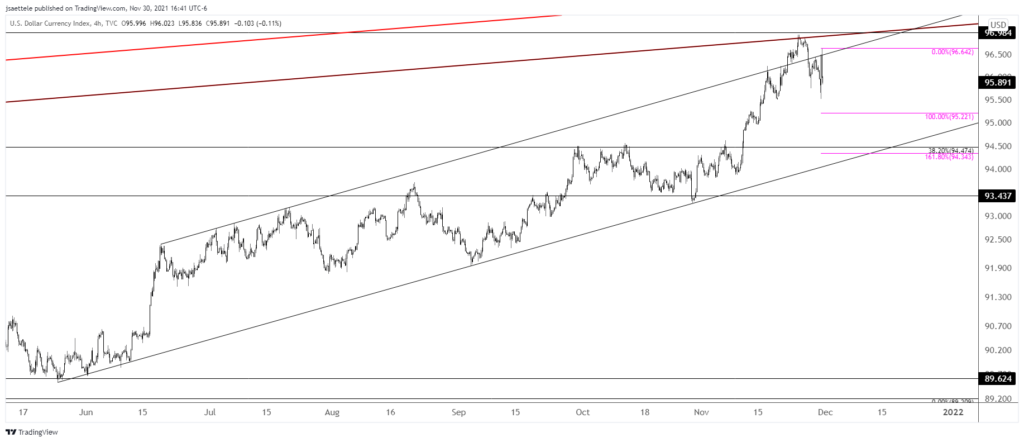
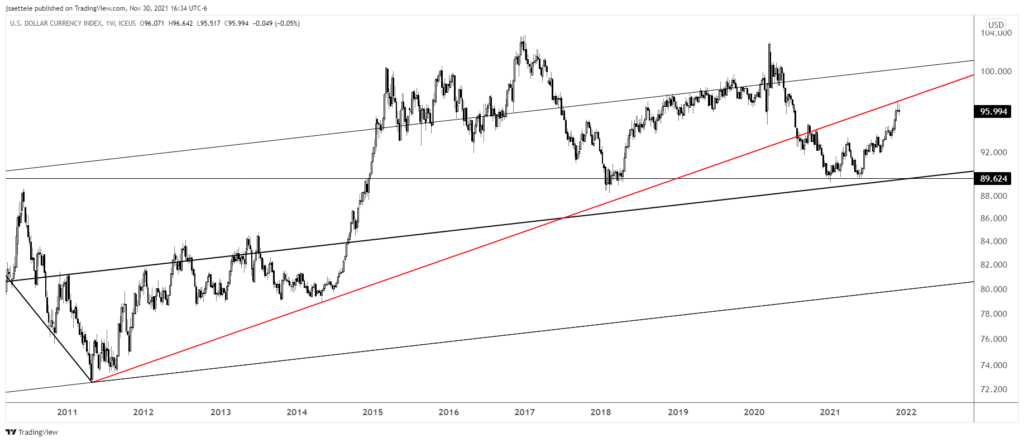
The DXY high is right on the trendline that was pointed out last week (see chart below for the full picture)…we may have just seen a major top. Trading wise, I’m looking towards 93.30/50 with 95.20s as a possible bounce level. The lower zone is channel support. That will be the big test. If DXY is a bear then 96.20s should provide resistance.
11/22 – The DXY rally is relentless but pay attention to 97 or so. This is the underside of the former support line that originates at the 2011 low. This line was resistance in 2020 so watch for resistance at the line again. Sentiment is getting interesting too. A google search for ‘US Dollar’ reveals stronger, active language (see below). If we extend a bit higher, then we may start getting predictions within headlines which would be a stronger indication of extreme sentiment and therefore increased risk of a price top. Finally, DXY tends to top out this week from a seasonal perspective (see 2 charts down). Bottom line, there are signs of extreme sentiment and 97 is a big level.
DXY WEEKLY
EURUSD DAILY
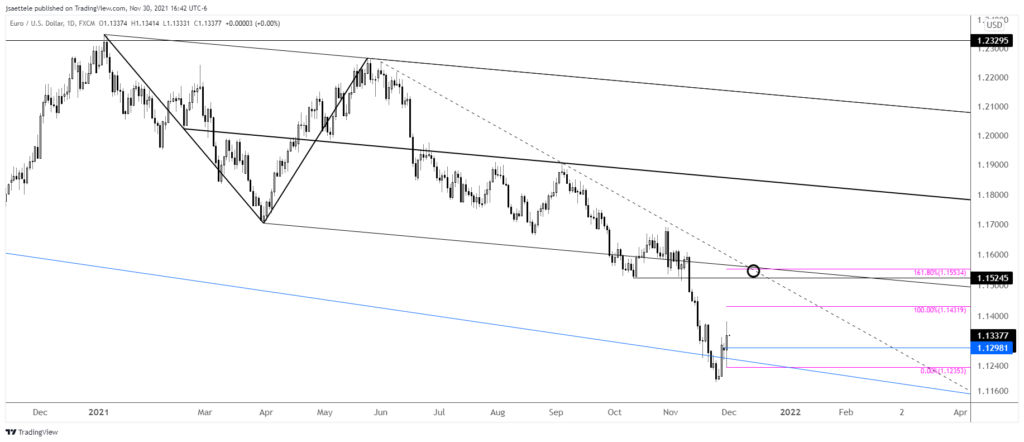
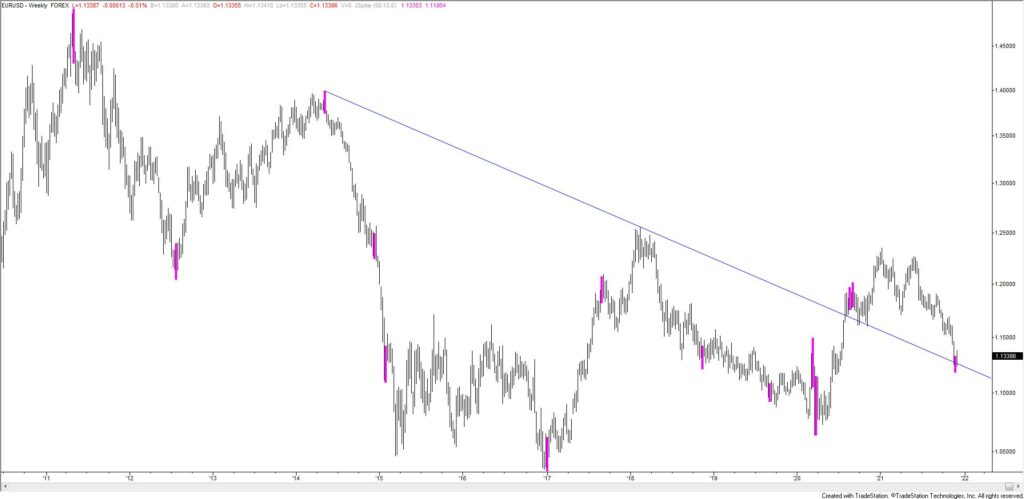
Remember that long term trendline (blue line…see full picture below) that was support on 11/17? I’m of the mind that price is basing around this line. The weekly chart below also shows weekly reversals (J-Spikes…price based only) at one year lows/highs. There are false signals of course but there are also a lot of great signals. I’m looking towards 1.1520/50 with a possible hiccup near 1.1430. If EURUSD is a bull, then 1.1287-1.1300 should provide support. The top of this zone is the week open.
EURUSD WEEKLY
GBPUSD DAILY
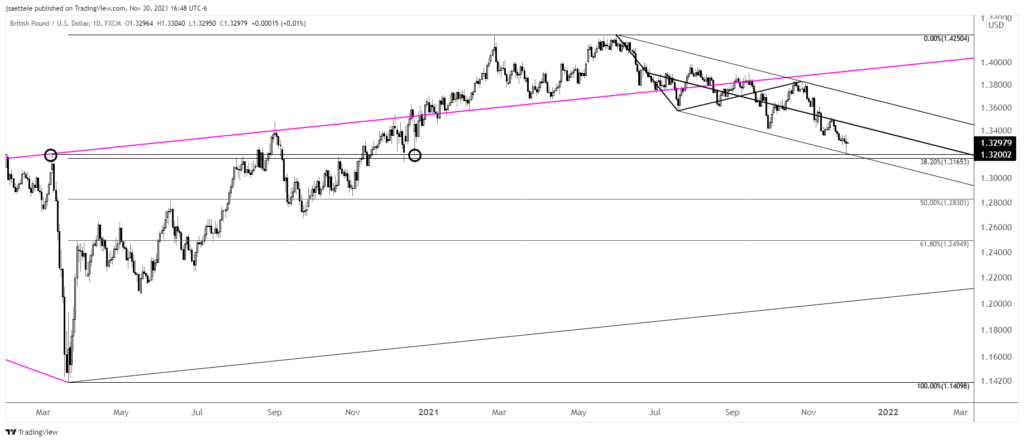
GBPUSD bottomed today at the bottom of its channel from the June high. The level is also defined by the March 2020 high (1.3200) and 12/21/20 spike low (these are circled). I’m looking towards the median line of the channel near 1.3450. If correct, then support should be 1.3250. I like the EURUSD setup better however.
USDJPY 4 HOUR
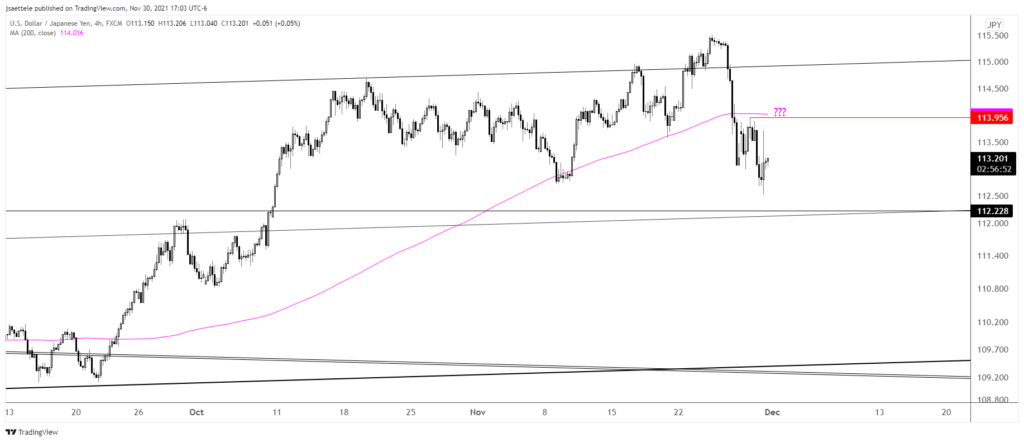
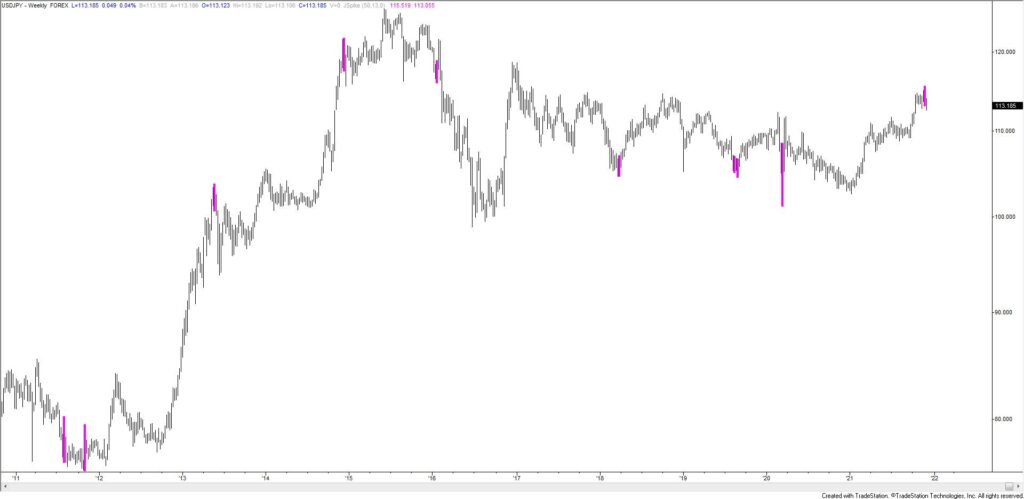
Despite today’s wild ride, I don’t have much more to add regarding USDJPY. I’ll note 114.00ish as resistance though. This is Monday’s high and the underside of the 200 period average on the 4 hour chart. This average was support in November. The weekly chart below shows weekly reversals (J-Spikes…price based only) at one year lows/highs. Nothing works all of the time but I love the combination of the reversal signal from the well-defined 115.50.
11/29 – USDJPY reversed sharply last week and high was 115.52! Near term downside focus is 112.20s and 114.50s sticks out as possible resistance. This is the 61.8% retrace of the decline from the high along with the 25 line of a short term fork. The 75 line provided support (so far) so resistance at the 25 line would make sense.
USDJPY WEEKLY
