Market Update 11/29 – Massive Yen Reversal in Play
GBPUSD DAILY
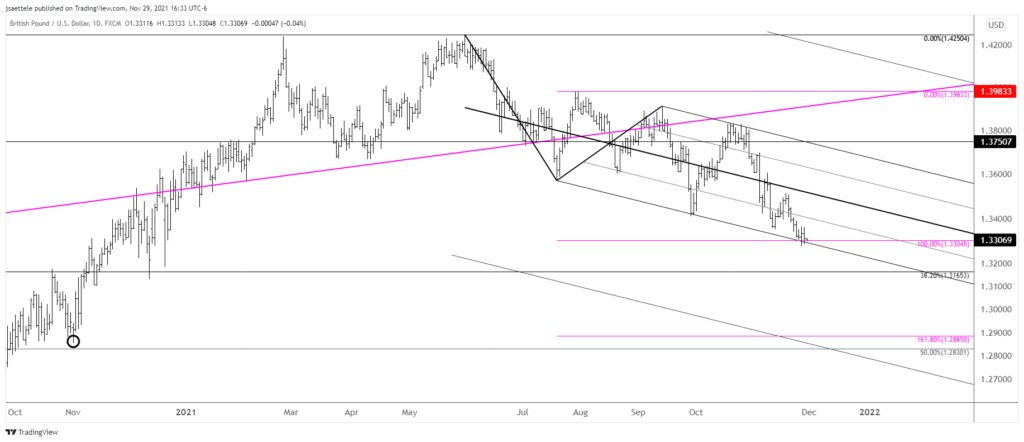
GBPUSD is trading an important confluence. 2 legs down from the June high is 1.3305. It’s possible that the decline from that high is an A-B-C decline with wave C as an ending diagonal. The lower parallel from a Schiff fork is also at this level. Price reversed sharply higher on Friday so follow through (above Friday’s high) would be viewed as a reason to turn bullish.
USDCHF DAILY
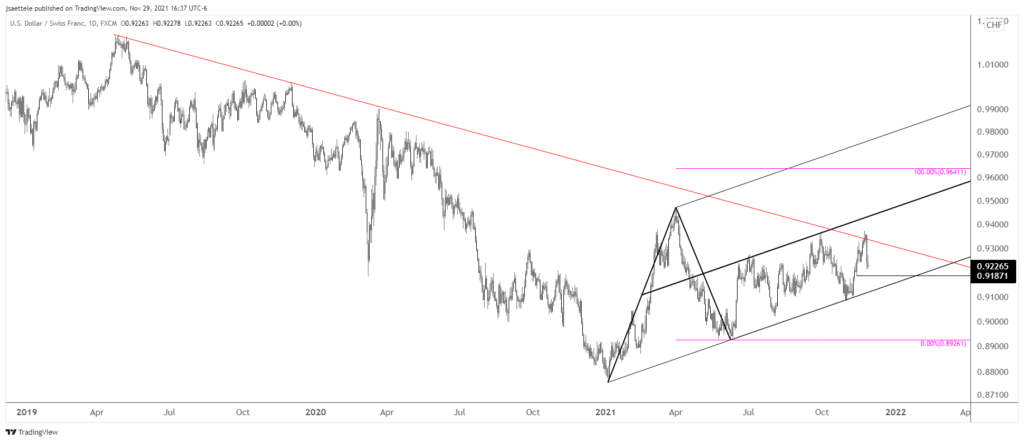
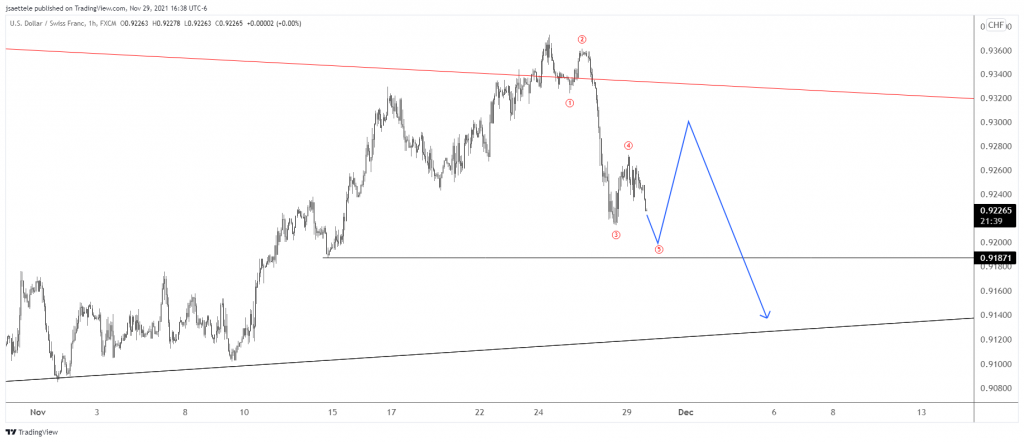
USDCHF reversed sharply lower after trading just above the noted trendline from the 2019 high. .9187 is a possible bounce level, especially given the possibility of 5 waves down from the high (see below).
11/22 – USDCHF is pips away from the trendline that originates at the 2019 high. Resistance is resistance until broken, so reversal evidence near the current level would warrant a short position. Of course, a break above would indicate an important behavior change and suggest a much larger advance is underway. Stay tuned.
USDCHF HOURLY
USDSEK DAILY
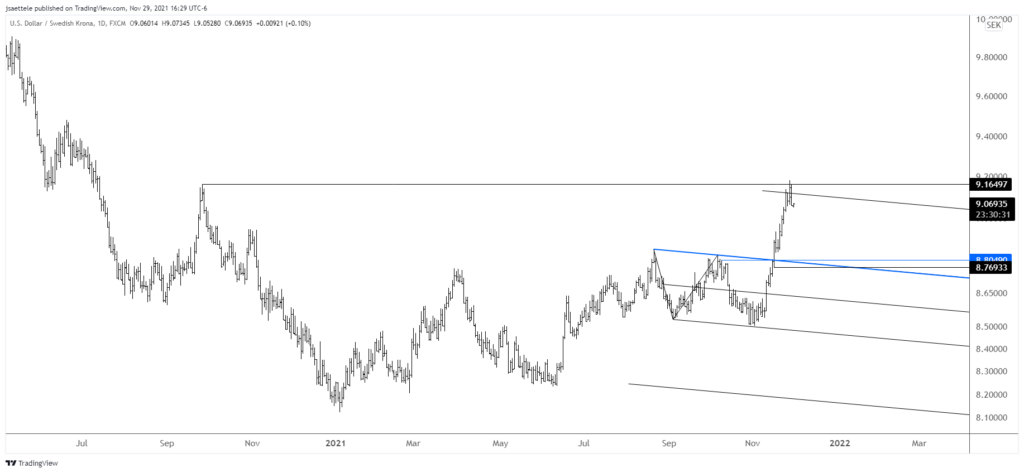
USDSEK has reached the noted target. This is another piece of evidence that points to a USD top. If USDSEK can drop in 5 waves on a near term basis, then I’ll look to plot a short entry.
11/16 – USDSEK has broken out. The top side of the breakout line is now proposed support near 8.8050. Upside focus is the September 2020 high at 9.1650.
USDCAD DAILY
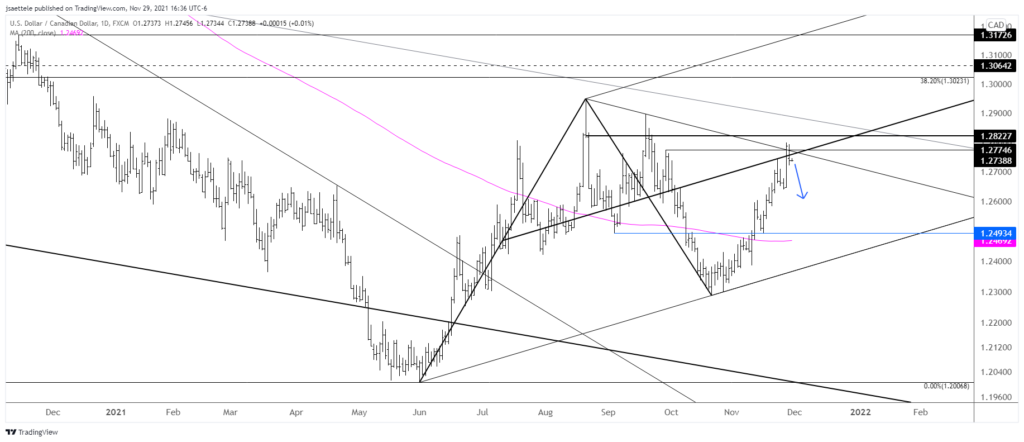
USDCAD reversed from near 1.2775 so I’m thinking lower. Weakness below 1.2720 warrant a bearish stance and short entry towards the noted 1.2500.
11/23 – 1.2775 sticks out as a key USDCAD level. The level is defined by the line off of the August and September highs. It’s also the 9/29 high. Do we get there though after today’s reversal? Watch for resistance near 1.2700. If price can put in a lower high near that level, then it’s worth a shot on the short side towards 1.2500. For reference, USDCAD opened the year at 1.2721 (see below)!
USDJPY 4 HOUR
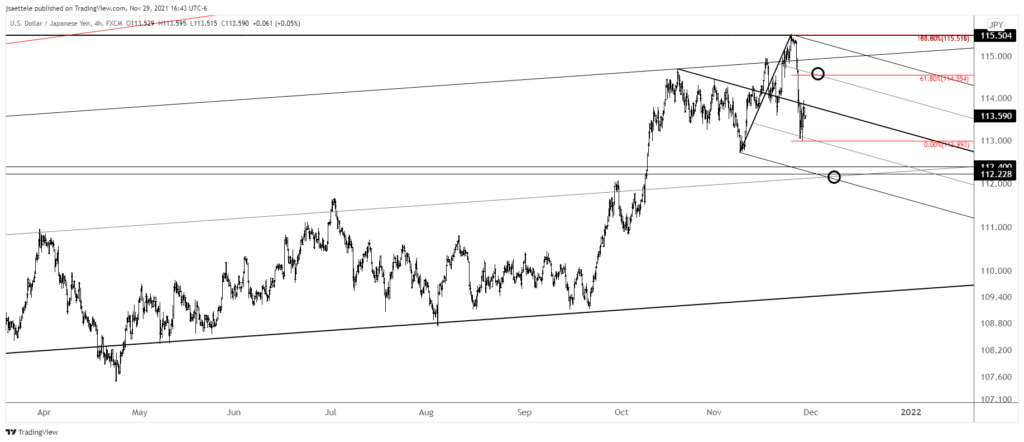
USDJPY reversed sharply last week and high was 115.52! Near term downside focus is 112.20s and 114.50s sticks out as possible resistance. This is the 61.8% retrace of the decline from the high along with the 25 line of a short term fork. The 75 line provided support (so far) so resistance at the 25 line would make sense.
11/23 – USDJPY closed at its best level since March 2017. The March 2017 high is 115.50, just pips under the 61.8% retrace of the 2015-2016 decline at 115.60. Notice also the ‘stickiness’ of the area around 116 from 2014-2016. I’m wondering if this level has a memory. Bottom line, USDJPY is closing in on a zone that I’m aware of for reversal potential…115.50-116.20. This is especially interesting in light of gold nearing possible support.
GBPJPY DAILY
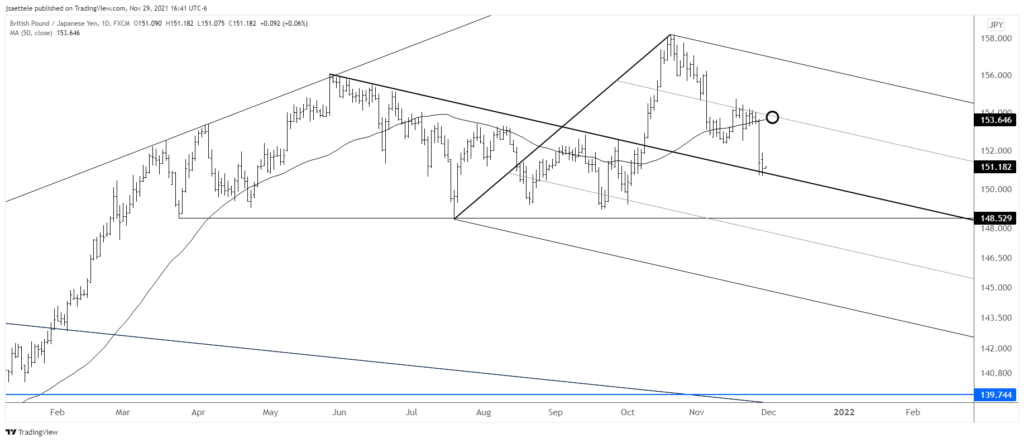
There is a pitchfork in play that originates from the May high. Price responded to the median line of that fork so a bounce wouldn’t surprise. Proposed resistance is the 25 line, which has already provided support and resistance. This line is near the 50 day average at about 153.65


