Market Update: December 21
GLOBAL MARKET CAP / GDP

When global market cap exceeds GDP, the market tends to correct. This ratio is also at its all-time high.
S&P 500 FUTURES DAILY

The line that connects highs since September in ES served as a ceiling yet again. I’m showing the futures chart because spot doesn’t show the extent of selling that we saw overnight. In a matter of hours, ES was trading at its lowest since November 30th. Then, in a matter of hours, ES was back above Friday’s low! 3590 is clearly the ‘trap door’ level (bearish below).
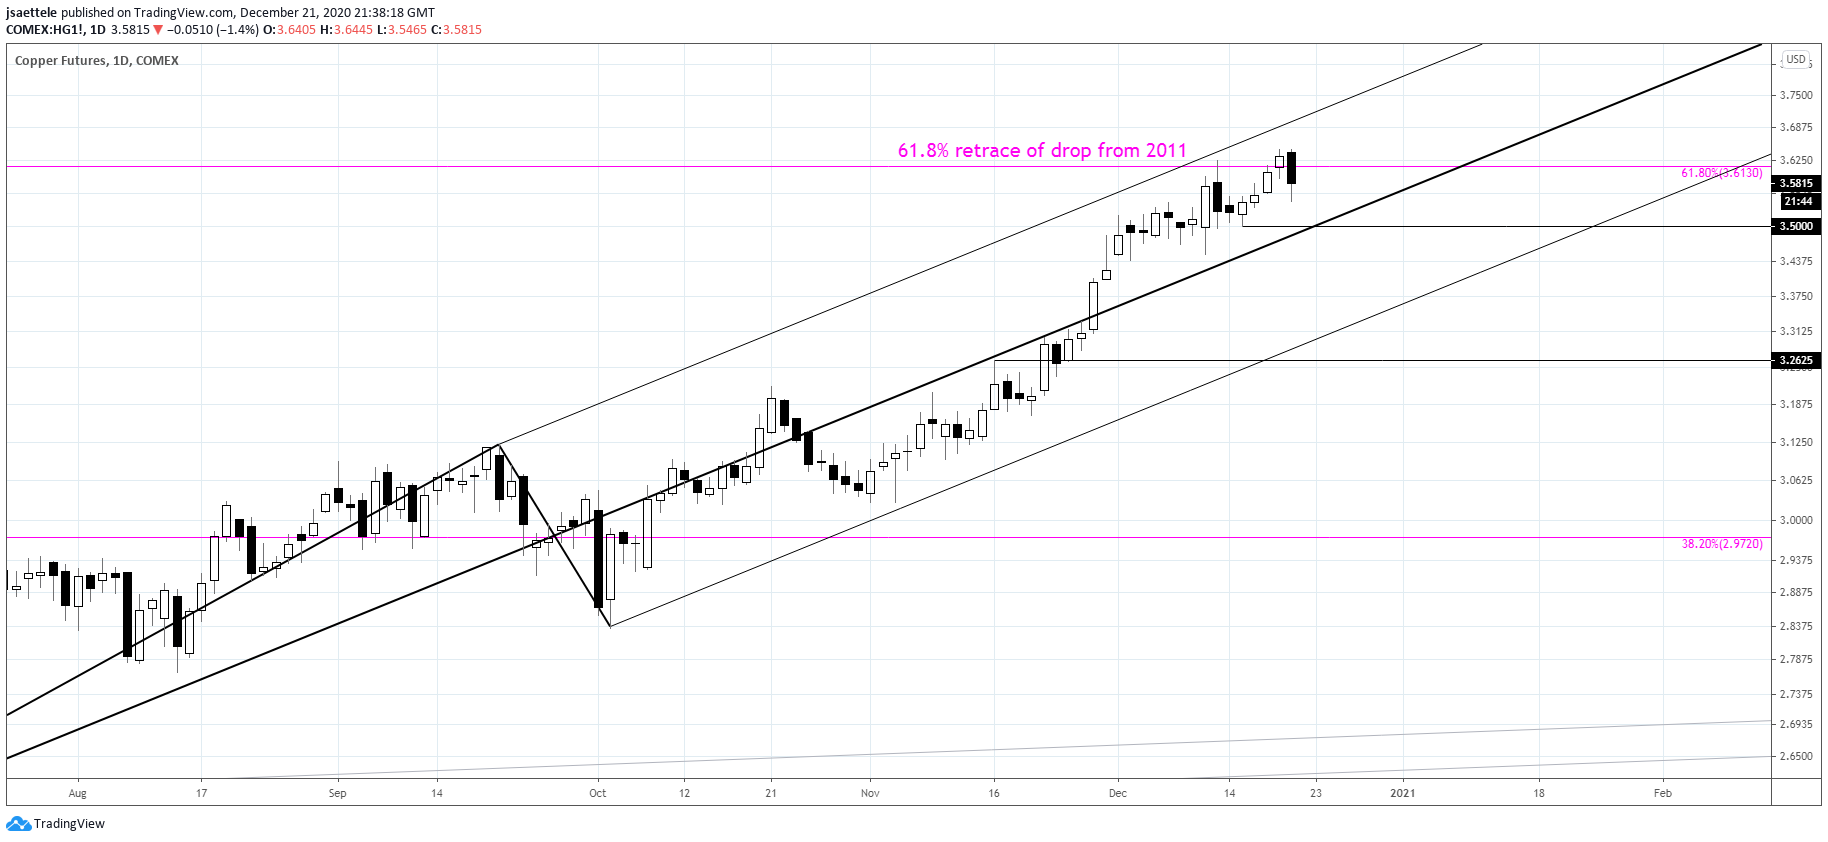
COPPER DAILY

Copper continues to trade on both sides of the 61.8% retrace of the decline from 2011. I continue to follow near term levels from the channel off of the March low. The center line is about 3.50. That needs to break in order to suggest that copper is lower, probably until the lower parallel.
SILVER 4 HOUR

Silver pulled back and nailed mentioned support. Respect potential for this support zone (24.86-25.07) to be tested a few more times in the current volatile environment but the general idea of ‘bullish on weakness’ remains favored.
12/17 – Silver has broken out. The series of lower highs and lower lows since August is no longer. I favor buying weakness with proposed support at 24.86-25.07. The next upside level of interest is the 9/15 high at 27.63.
EURUSD 4 HOUR

EURUSD held the center line of the channel from the 11/2 low…again. This line has been support since 12/9. Clearly, it’s important. One scenario to consider is that weakness since last week is a 4th wave within the 5 wave cycle from the November low. If this interpretation is correct, then a drop to 1.2060/70 would unfold before one more leg up unfolds.
12/20 – EURUSD analysis is the same as DXY…just in reverse. A 5 wave drop from the high would present a bearish opportunity on a small bounce. Levels to watch over the next day or so are the short term center line near 1.2150 for a bounce and 1.2220s for resistance. The big test for bulls on a swing basis is the lower parallel near 1.2040.
AUDUSD 4 HOUR

.7675ish is still a possibility in AUDUSD. Today’s drop held the line off of the 6/15 and 6/30 lows. That line has been an important pivot since early October as resistance and then support. As such, a break below would indicate an important behavior change. So, watch for either AUDUSD to test .7575 (then see what happens) or turn bearish on a break under .7458.
12/17 – AUDUSD reached the noted .7637 today (basically trading there now) but there is no sign of a reversal to this point. I’m showing a zoomed in version of the chart from yesterday’s post. The line off of the 2008 and 2015 lows (red line) is about .7675, which is also the high from June 2018. Focus on that level for a reversal. Also, daily RSI is above 78. The next 3 charts show all instances of this occurring over the last 20 years.
USDCAD 4 HOUR

USDCAD nailed the mentioned 1.2950 and turned on a dime. 1.2792 remains proposed support, especially because the 61.8% of the rally is now the same level. I’m inclined to expect a hold at that level since it’s reinforced by the top side of the wedge line from the October high.
12/20 – USDCAD has broken above the mentioned 1.2800 and immediate focus is 1.2920/50. Strength above there would open up 9 month trendline resistance near 1.3100. The top side of the just broken trendline should provide support now near 1.2792.


