Market Update 1/5/2021 – Bitcoin Warning
BTCUSD DAILY
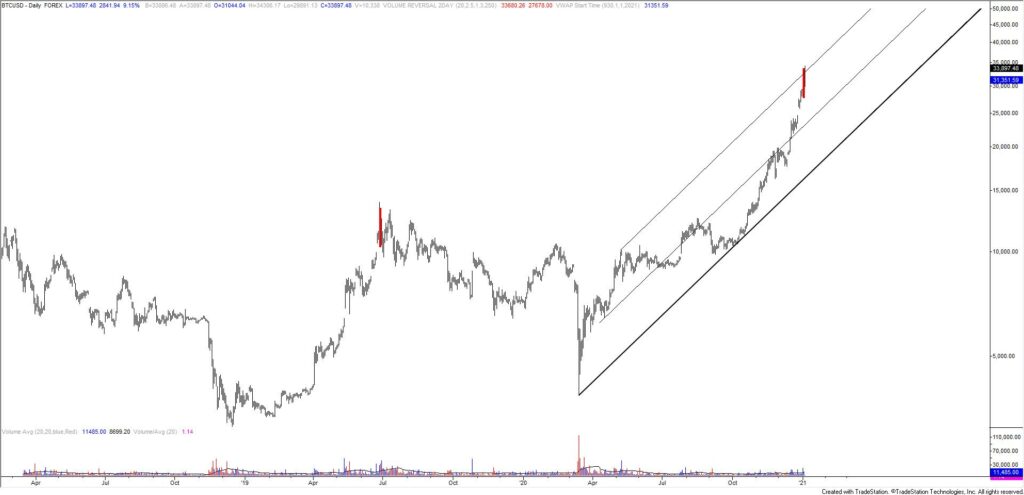
Bitcoin! There aren’t enough superlatives to describe the recent rise. That said, pay attention at this level. Yesterday (first trading day of the year), BTCUSD completed a 2 day volume reversal. This means that the price rallied on significant volume and declined on significant volume the very next day. BTCUSD price history on TradeStation starts in August 2011 so this ‘study’ is in no means exhaustive. Still, the only other 2 day volume reversal occurred at the June 2019. Price is also at the top of an extremely steep channel so I’m on alert for something else besides parabolic rally.
NASDAQ COMPOSITE DAILY
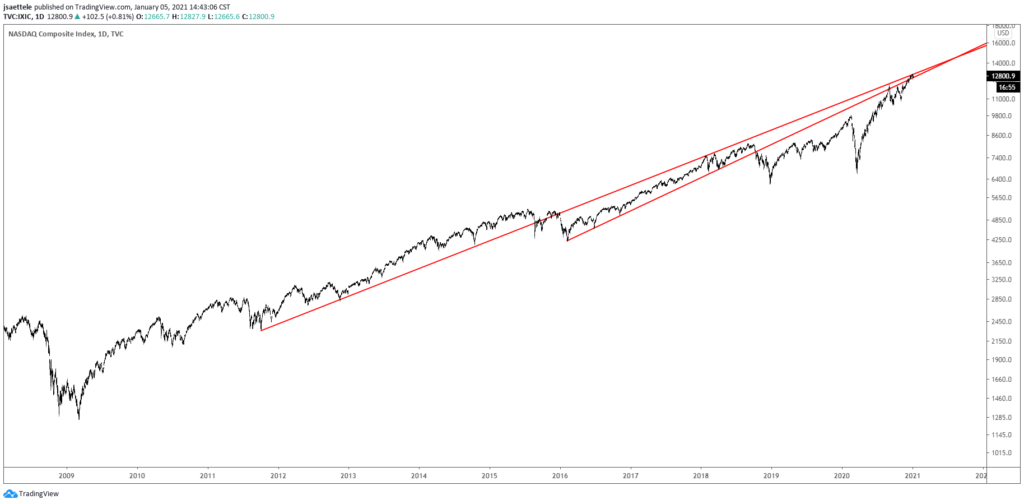
The Nasdaq composite has been pressing against the confluence of 10 and 5 year trendlines since August. Both lines were former support lines turned resistance. Given yesterday’s ‘first day of the year reversals’, I’d not be surprised to see a change in course in the Nasdaq at the current juncture.
DXY DAILY
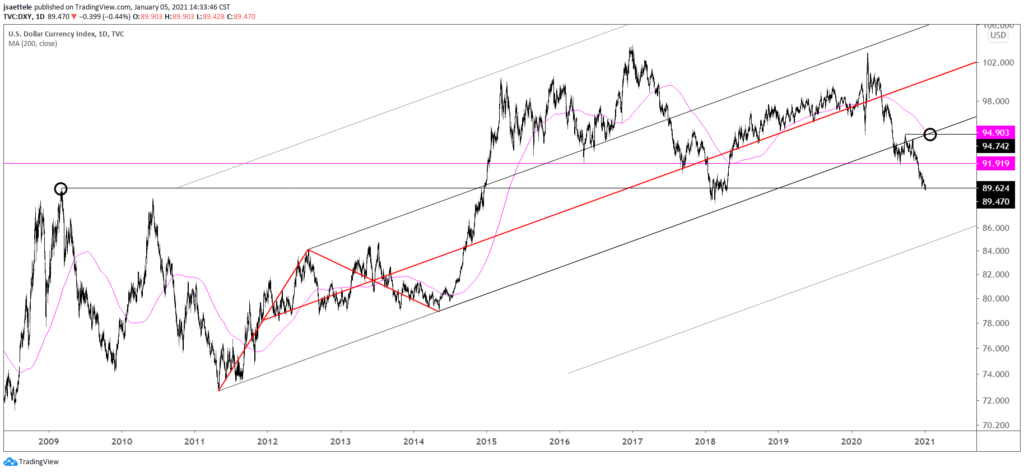
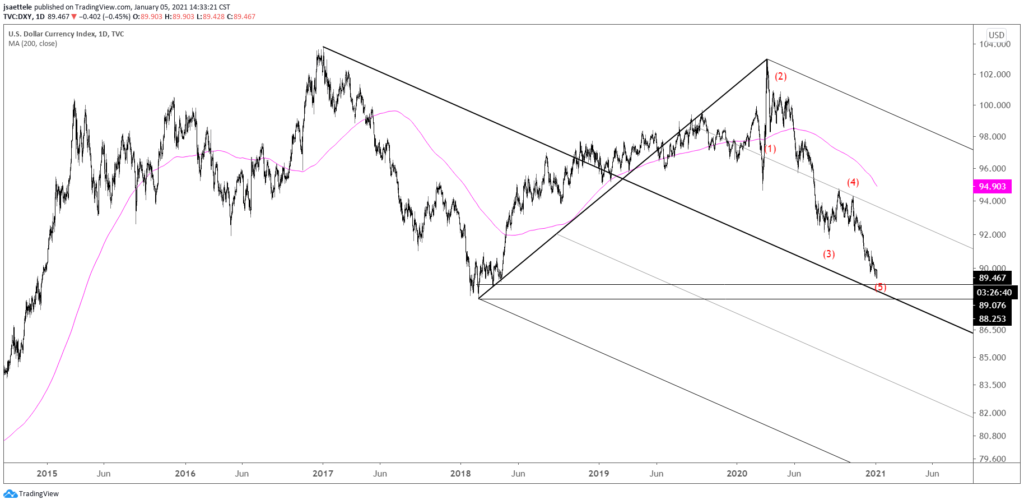
DXY is still sitting on a massive horizontal level. The level in question is defined by the 2009 high and the area that price bottomed at in 2018. Big spot. The 2018 low is 89.08. This level is also the median line from the pitchfork structure that originates at the 2017 high (see below). So, ‘thinking’ reversal between now and then. Subjectively, I believe that the reversal is now given yesterday’s volume reversal on UUP.
1/3 – I like to observe the first few days of the year and let jockeying for position lead to setups but it’s worth noting that DXY tends to be strong in January. This fact, combined with several weekly reversals (charts below) during the last week of 2020, present bullish USD setups to begin 2021.
DXY DAILY
EURUSD DAILY
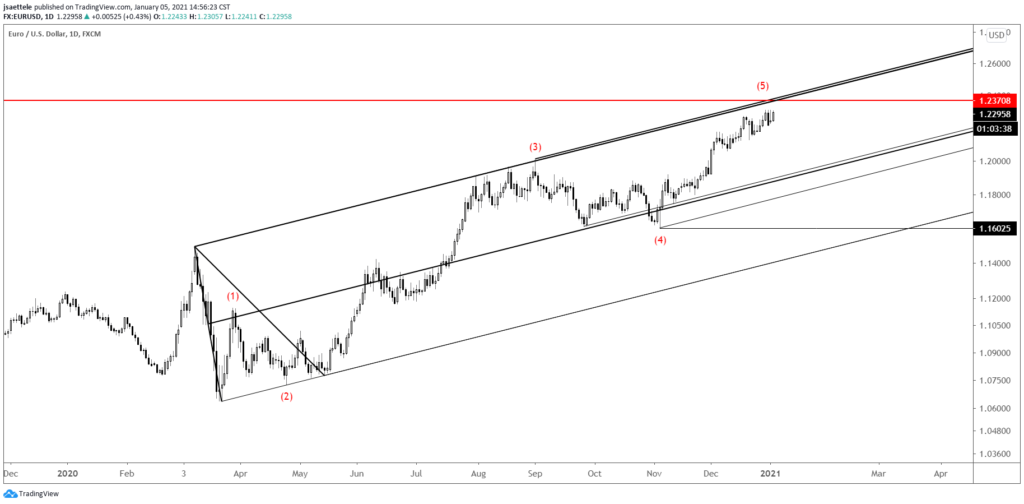
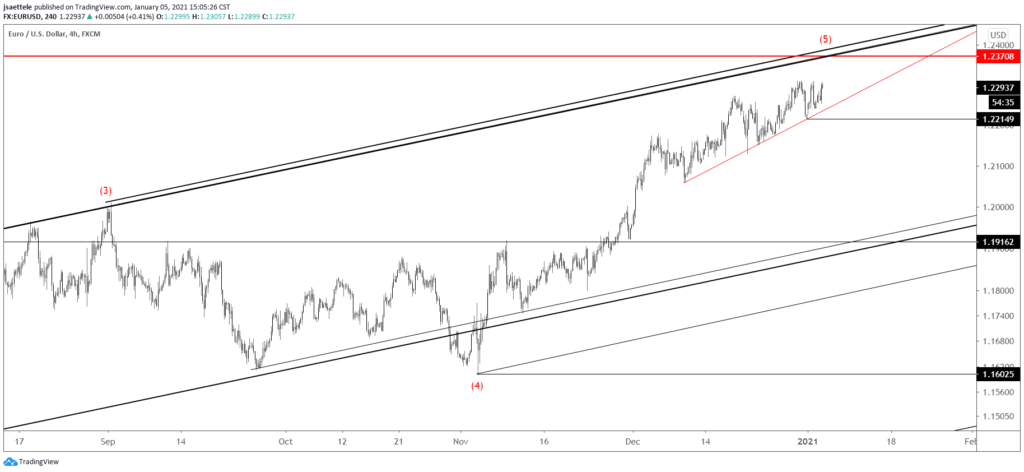
There are 2 levels to know for EURUSD, 1.2370 and 1.2215. The former level is the top of channel resistance from the March low. The latter level is Monday’s low. Either watch for resistance near 1.2370 or turn bearish on a break below 1.2215, which would also break a short term trendline (see below).
1/3 – The magenta bars indicate weekly ‘J-Spikes’. If you’re unfamiliar, a J-Spike is a key reversal with a volatility filter. Basically, key reversals are filtered for higher volatility in an attempt to reduce false positives. As you can see on the chart, there are false signals but the signal has also identified some major turns. I’ll allow for the first trading of the year (at least) to pass before zooming into near term action to see if there is a pattern for entry. One reason to wait is to allow for an opening range for the new year to set for objective reference points.
EURUSD 4 HOUR
NZDUSD WEEKLY
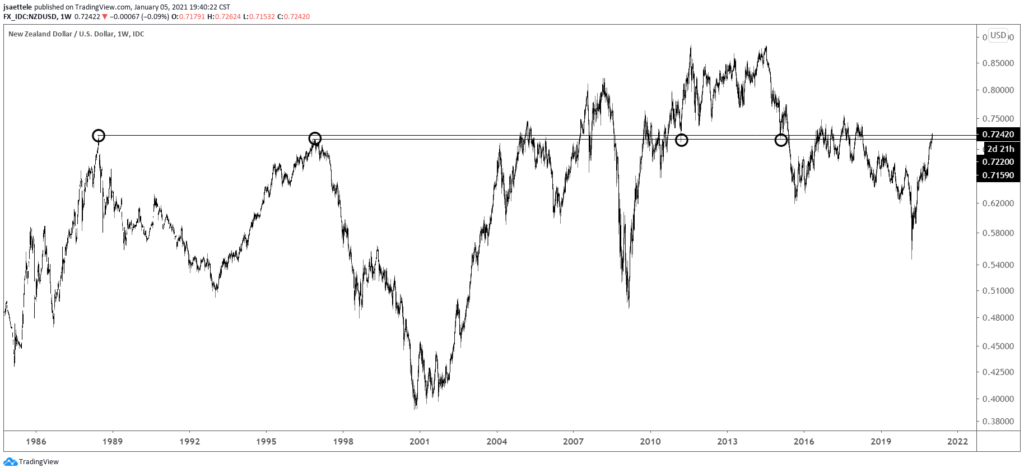
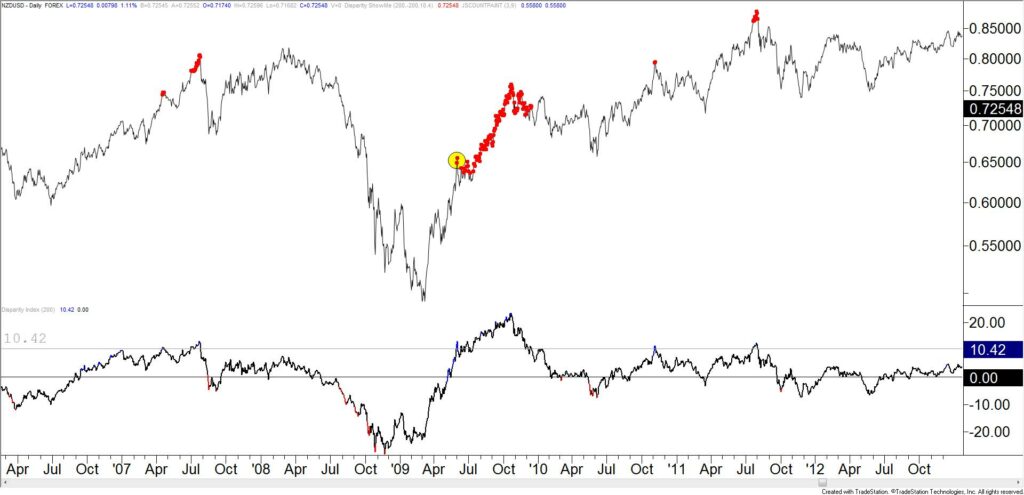
Mid-.7200s has been a huge pivot for NZDUSD several times in its history. Notably, the 1988 and 1996 highs are near the spot price. Major turns occurred here in 2011 and 2015 as well. The chart below shows the percentage that price deviates from the 200 day average. Over the last several decades, a 10.4% reading above the 200 day average is rare. In 2009, the price remained above this threshold for an extended period of time but the initial reading led to a 3 figure sell-off. By this measure of momentum, bulls are flirting with danger.
NZDUSD DAILY
