Market Update 8/30 – USD into Support
Market Update 8/25 – Fade the USD Drop Soon?
August 26, 2021Market Update 8/31 – Pivot Low in the USD?
September 1, 2021
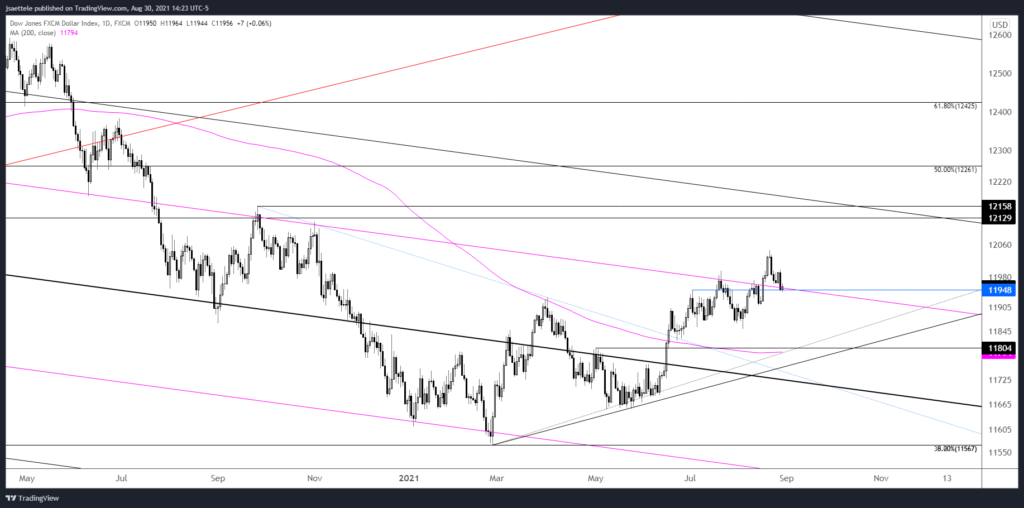
USDOLLAR DAILY
***I’m currently unable to access all of my TradingView charts but am in contact with the company in order to troubleshoot the issue as soon as possible.***
USDOLLAR is testing proposed support at 11950. Pretty simple here…price needs to hold this level in order to remain constructive and trade the USD from the long side. A break here would indicate an important behavior change and suggest that a deeper drop is underway…possibly towards 11800 or so.
8/23 – USDOLLAR is pulling back sharply following the breakout last week. This is still a breakout but support needs to register from the magenta parallel (formerly resistance) near 11950 in order to maintain a bullish outlook.
EURUSD DAILY
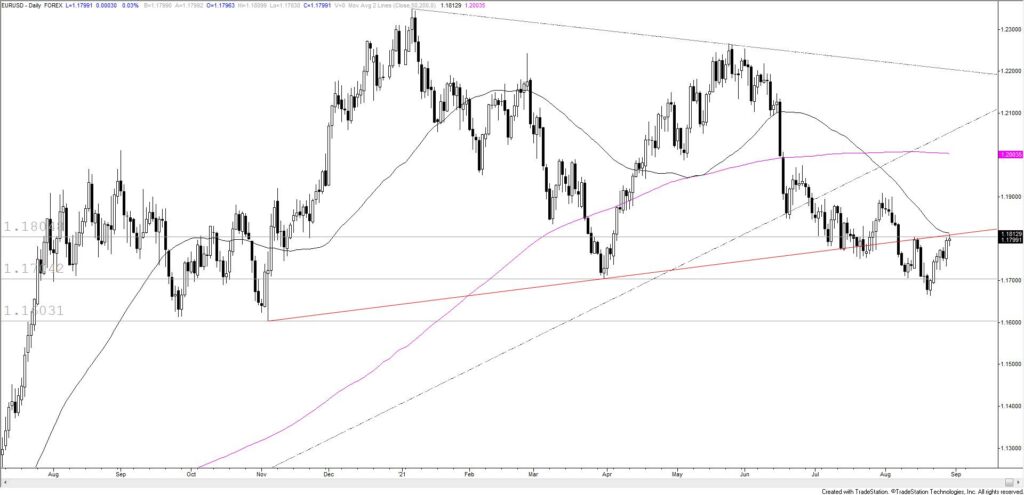
As one would think given USDOLLAR analysis, EURUSD is testing important resistance. 1.1800 (as noted last week) is being put to the test and this level needs to hold in order to continue looking lower. Today’s range is virtually non-existent so I’m on the lookout for a reaction (reversal or breakout) before committing to a direction. A break above would open up the 7/30 high at 1.1909.
8/25 – Today’s update is brief as markets await Jackson Hole. The USD drop off of the high (squeeze off of the low in most everything else) is nearing support. I’m looking to buy the USD dip slightly lower. Notably, EURUSD 1.1800 is the 50 day average and 8/13 high. Bears need to step up there in order to keep 1.1600 on track.
AUDUSD DAILY
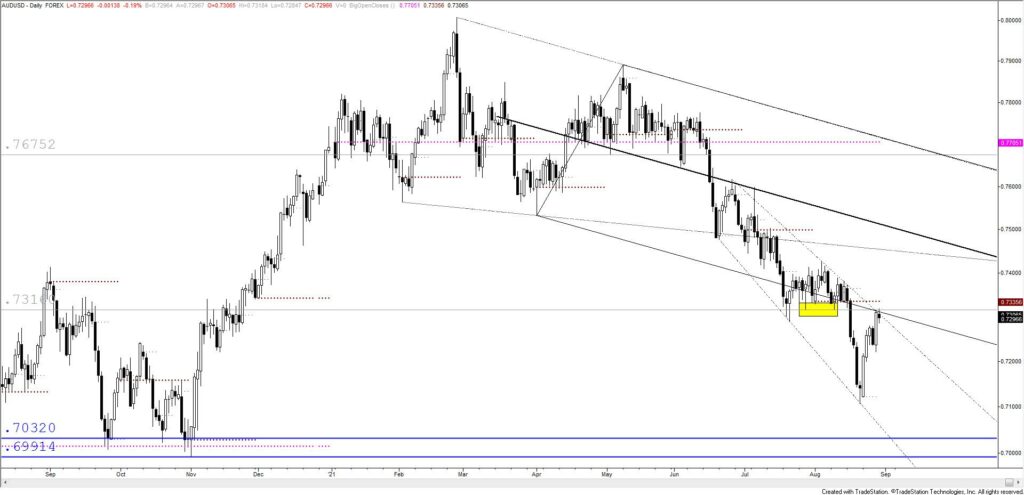
Surprise…AUDUSD is also testing the bull/bear dividing line! The current level is well-defined from former support, the underside of the lower parallel from the YTD channel, and trendline resistance. A break above would indicate an important behavior change. I’m looking for price to resume lower but there is no setup to short in this quiet market. A spike higher and reversal lower on Tuesday would be ideal to establish a short.
8/25 – Broadly speaking, AUDUSD downside remains favored until .7000/50…and .7290-.7315 remains proposed resistance. Nothing has changed!
USDCAD 4 HOUR
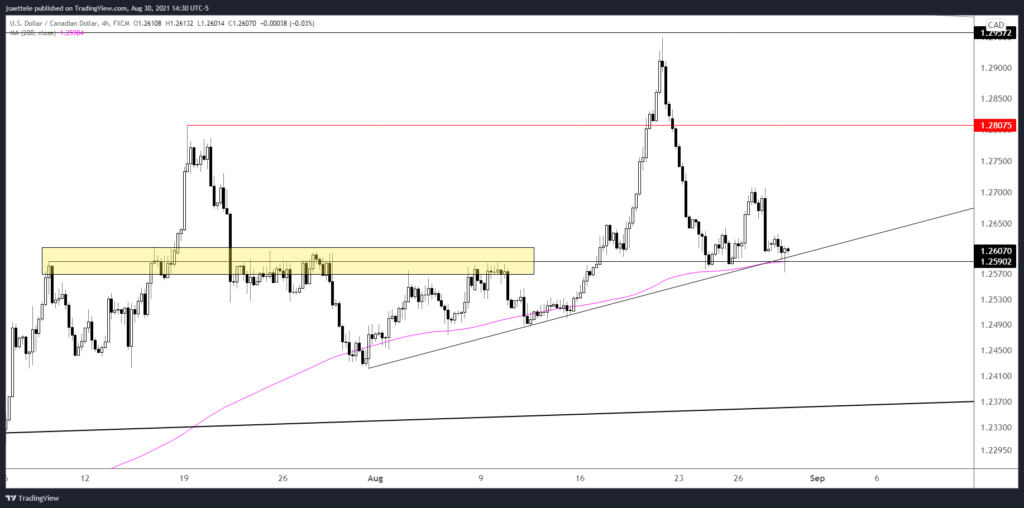
USDCAD is also testing a key level. Resistance since July, a month long trendline, and the 200 period average on the 4 hour chart define the current level. I’m looking for price to hold today’s low and resume higher towards 1.2800. Strength above the high volume level from Friday at 1.2628 would warrant a long position.
NZDUSD 4 HOUR

Kiwi is one of the few USD crosses that isn’t testing what I deem a critical level. The important level for NZDUSD is slightly higher…near .7050. This is nothing more than the 25 line within the channel that originates at the YTD high. The concept of ‘median line symmetry’ has been on display for months as highs have registered on/near the 25 line and lows on/near the 75 line. Let’s see if it happens again.