Market Update 1/6 – More Reversal Evidence
NASDAQ FUTURES (NQ) 4 HOUR
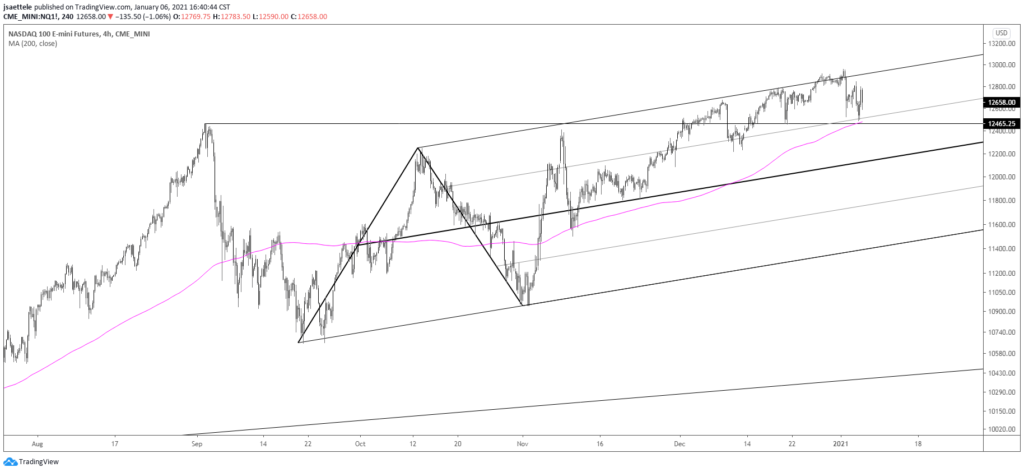
Markets tried to reverse overnight but then reality set in. That is, participants realized that the U.S. session was about to begin therefore stocks had to rally and the USD had to drop. Even BTCUSD was down for a time overnight…I thought my computer was broken when BTCUSD briefly turned negative during European hours. Regarding Nasdaq specifically, today’s low is important because it’s just above the September high and 12/21 low. Consider today’s low the pivot.
1/5 – The Nasdaq composite has been pressing against the confluence of 10 and 5 year trendlines since August. Both lines were former support lines turned resistance. Given yesterday’s ‘first day of the year reversals’, I’d not be surprised to see a change in course in the Nasdaq at the current juncture.
SPOT SILVER DAILY
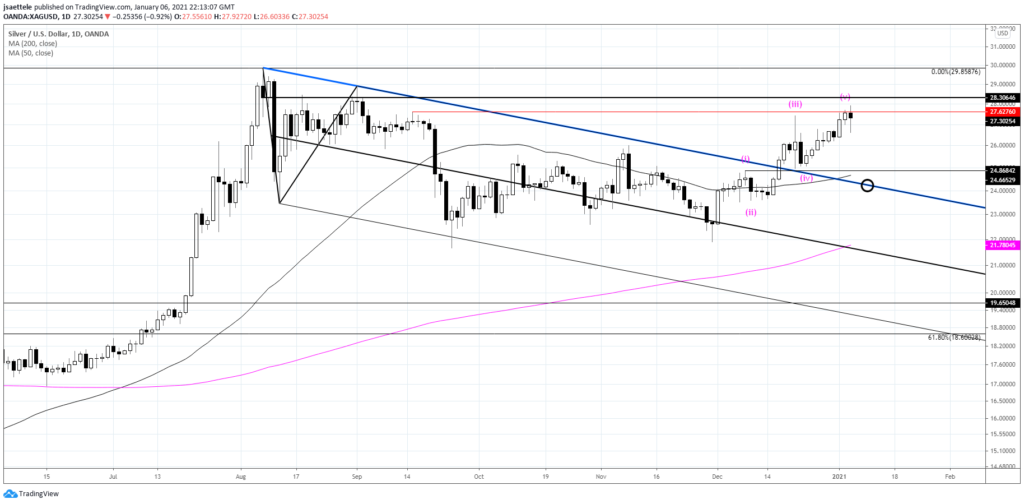
Silver has been pressing against the 9/15 high for the past 3 days. Price turned sharply lower today before rebounding (remember the U.S. session magic). Again, the rally ‘counts’ as an impulse so respect potential for a corrective drop back towards a 24 handle.
1/4 – Support was tested again and silver made a new high. The rally from the 11/30 low is in 5 waves so expectations are that a corrective pullback begins from nearby levels. Eventual support is probably the top side of the former resistance line (in blue). That line is currently about 24.40.
CRUDE OIL DAILY
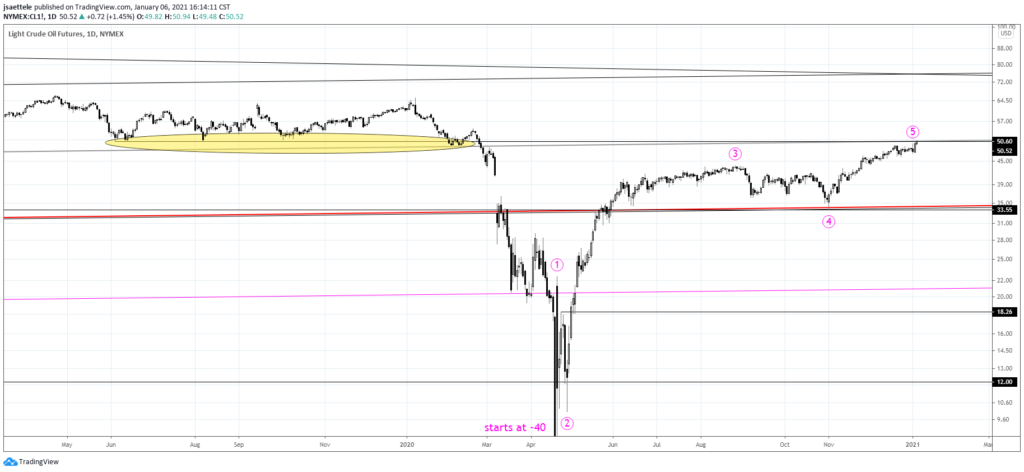
50-51 is big for crude. This zone was critical support in 2019. Once the level broke early last year, crude went into a swan dive. As noted 2 days ago, the rally from the April negative print does compose 5 waves. 5 waves up plus a massive market level in the form of former support (turned resistance?) indicates reversal potential.
1/4 – Crude oil reversed sharply lower in what may have marked the end of a 5 wave rally from the -40 print in April. If this interpretation is correct, then price heads back towards 33.55.
U.S. DOLLAR INDEX FUTURES DAILY
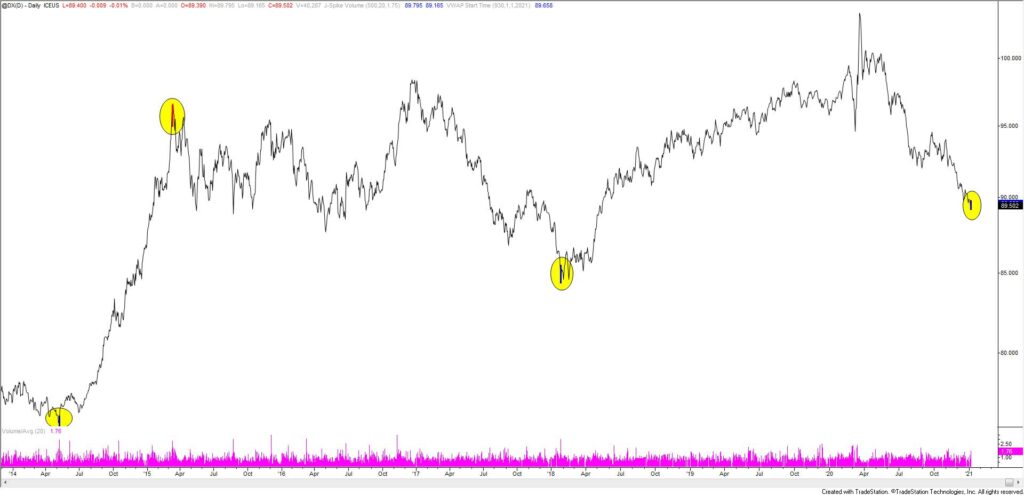
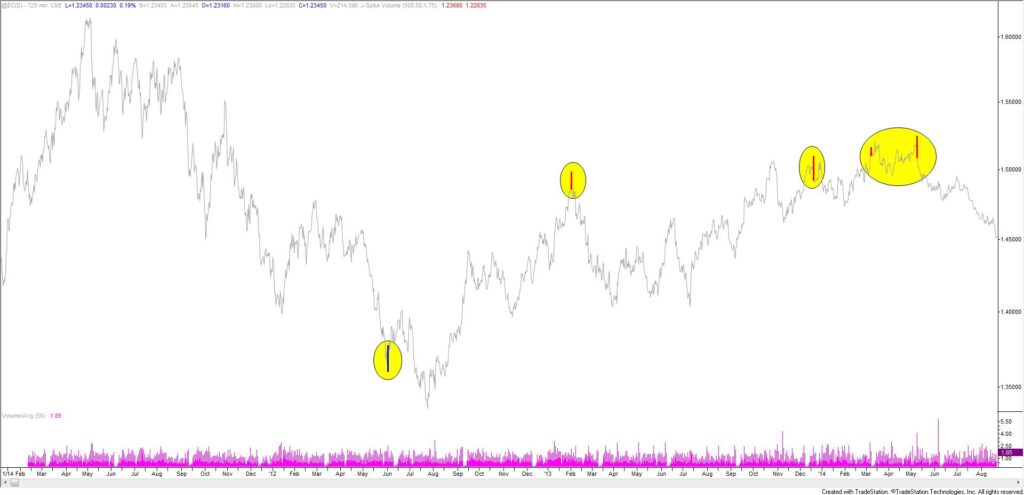
Another reversal signal…this time in USD index futures. Price made a key reversal today on extreme volume at a 2 year price extreme. Red and blue bars indicate when those conditions have been satisfied. This is the 4th such signal in the last 10 years. The prior 3 identified the 2014 low, 2015 high, and 2018 low. Probably wise to pay attention.
1/5 – DXY is still sitting on a massive horizontal level. The level in question is defined by the 2009 high and the area that price bottomed at in 2018. Big spot. The 2018 low is 89.08. This level is also the median line from the pitchfork structure that originates at the 2017 high (see below). So, ‘thinking’ reversal between now and then. Subjectively, I believe that the reversal is now given yesterday’s volume reversal on UUP.
EURUSD 4 HOUR
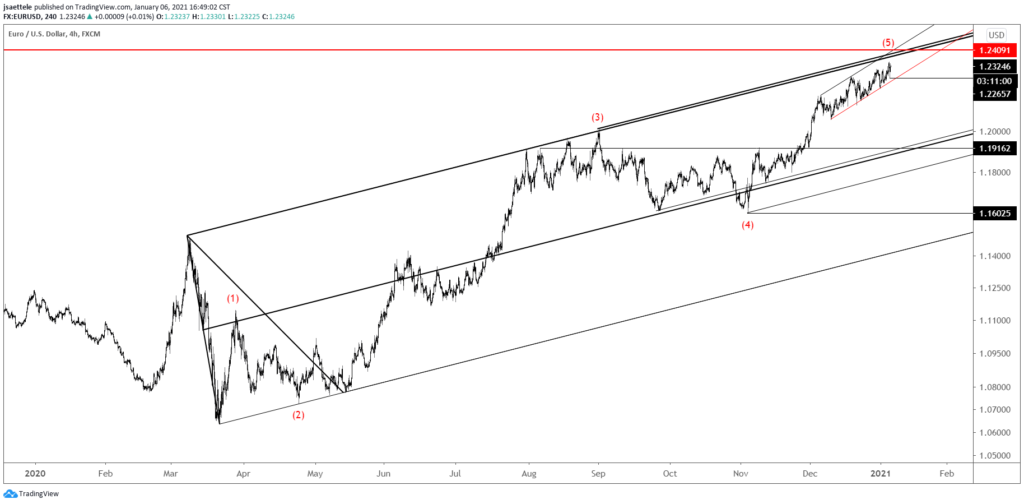
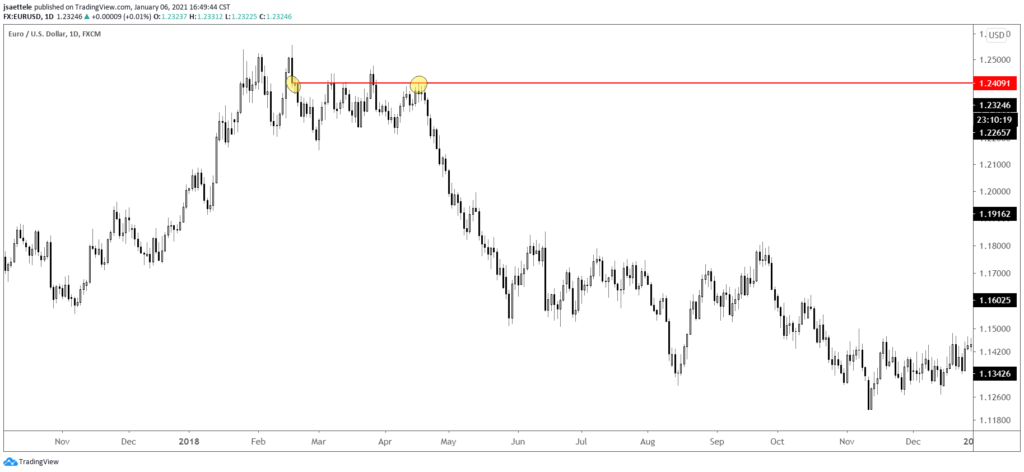
The only thing to update for EURUSD is the breakdown level, which is now about 1.2260. This is also a good time to highlight an example of ‘daily reversal resistance’. Daily reversal resistance is the close of the high bar of the previous move. In this case, that’s the 2/16/2018 close, which is 1.2408 (also the 4/18/2018 high…see below). If reached, that level is proposed resistance. So, I’m looking to either short under 1.2260 or near 1.2400.
There are 3 futures charts below as well. The interval setting is 12 hours (half day). There was a 12 hour volume reversal today. The 3 charts show all 12 hour volume reversals from 2 year highs over the last 10 years. Yet additional reversal evidence!
1/5 – There are 2 levels to know for EURUSD, 1.2370 and 1.2215. The former level is the top of channel resistance from the March low. The latter level is Monday’s low. Either watch for resistance near 1.2370 or turn bearish on a break below 1.2215, which would also break a short term trendline (see below).
EURUSD DAILY
EURO FUTURES 12 HOUR
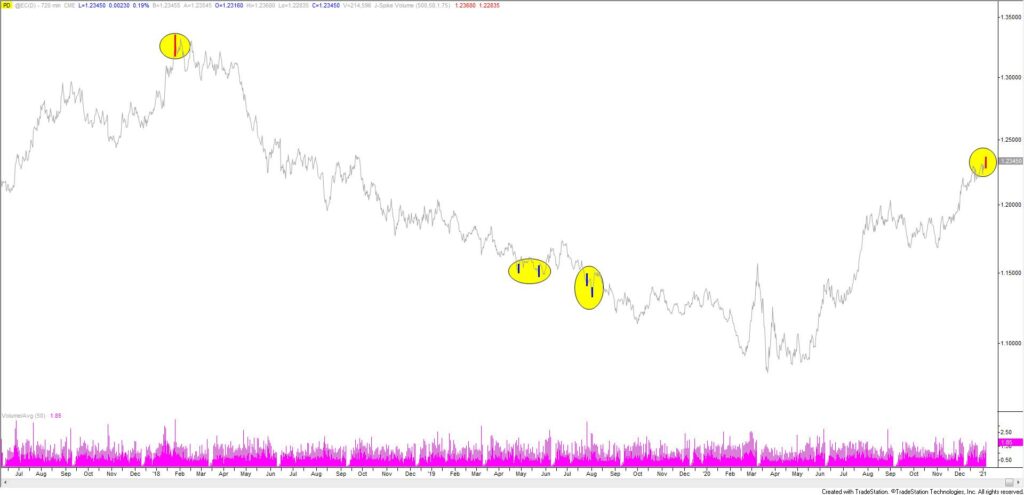
EURO FUTURES 12 HOUR
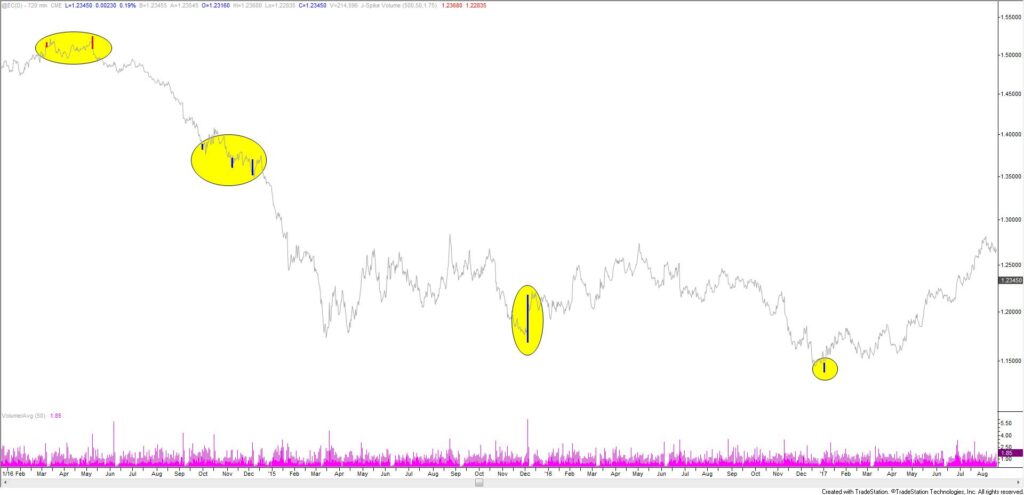
EURO FUTURES 12 HOUR