Market Update – July 7
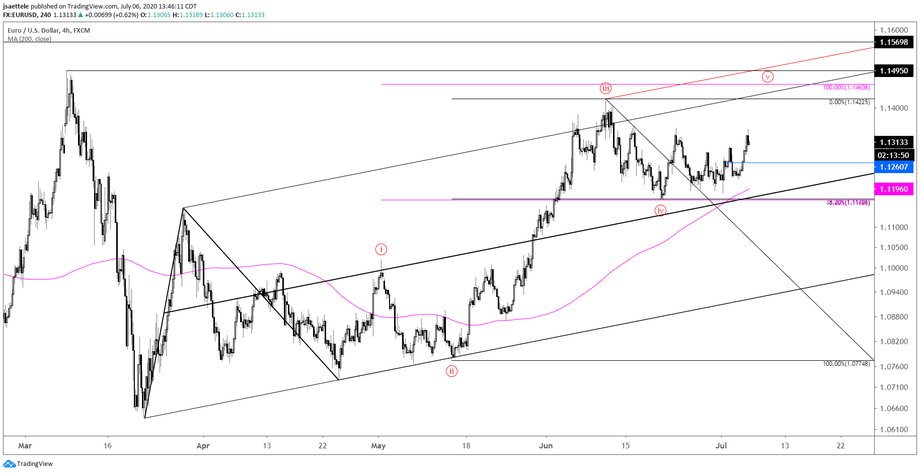
EURUSD 4 HOUR
The EURUSD drop from 6/10 to 6/19 retraced exactly 38.2% of the rally from 5/7. 4th waves often retrace 38.2% of 3rd waves. The implication is that EURUSD is headed higher in a 5th wave. A possible target is where wave 5 would equal wave 1 at 1.1460. The high volume level at 1.1261 is a good spot for support (the year open is 1.1260 by the way). Be aware of the current ownership profile however (see below). Speculators are the most long since the 2017 high. Extremes in positioning can last for extended periods of time but you don’t want to get caught holding the bag if price reverses (use stops!). As the famous 19th century Dickson Watts said, ‘go cautiously with the crowd and boldly against.’ In summary, EURUSD is set up to exceed the June high before reversing lower.
EURO COT (FROM FREECOTDATA.COM)

GBPUSD HOURLY

GBPUSD low on Friday was 1.2437…so proposed support is holding. From a near term pattern perspective, a test (slight undercut) of 1.2437 would make the decline from 7/2 in 3 waves and set the stage for the next leg higher. Also, VWAP from the 6/29 low (see below) reinforces the neckline near 1.2437 as support.
7/1 – GBPUSD followed through on its bullish reversal from parallel support. Simply, support for entry is 1.2410/37. This is a short term neckline and 6/26 high. Short term upside focus is 1.2648/88 (former highs, underside of recent trendline support, and 200 day average) but longer term bullish potential is significant.
BRITISH POUND FUTURES HOURLY

USDCAD HOURLY

The USDCAD rally from 6/10 is clearly in 3 waves and the decline from 6/26 is in 5 waves. Expectations are for a bounce before additional downside within the bearish channel from the March high. Ideal resistance is 1.3617/30. This is the high volume level from last week, 6/22 high, parallel within the channel (magenta line), and underside of the just broken trendline. The futures chart below shows CAD VWAP from the 6/26 low (high in USDCAD) and 2020 VWAP, which would be the equivalent of 1.3420s in USDCAD.
6/29 – USDCAD traded 1.3616 on Friday before making an inside day today. Proposed resistance is still slightly higher…about 1.3740. I’m on alert for a reversal near that level. However, if price breaks above then I’d be willing to go with strength because that would represent a move through a short term bullish median line. Focus would be on 1.3890-1.3920.
CANADIAN DOLLAR FUTURES HOURLY

AUDUSD HOURLY

The idea that a triangle was unfolding in AUDUSD was nullified after price took out the 6/23 high. As long as price holds the lower parallel of the Schiff fork from the March low, I have to respect additional upside. If it breaks, then I’ll turn bearish. Ideal support is .6912/24. This AUDUSD chart is basically the opposite of the USDCAD chart. Pay attention to the median line, which is just above the 6/10 high at .7064, for resistance. Be aware that RBA is today.


