Market Update 6/29 – Long Term Views
NZDUSD 4 HOUR
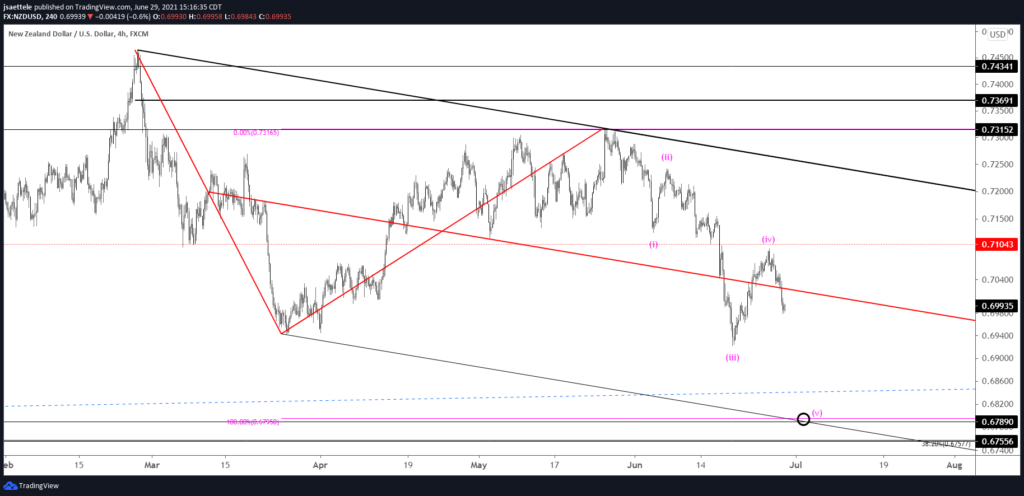
***I used some travel time over the last week to update long term charts. I’ve reproduced those charts in today’s post (after the shorter term charts).***
NZDUSD went slightly through the median line (red line) but that line remains proposed resistance near .7020. Downside focus is the long held .6800 level (2 equal legs are at .6795).
6/22 – NZDUSD is at noted resistance now so I’m looking for price to roll over. Again, the level is noted by the center line from the channel since February, 2 equal legs up from the low, and the 38.2% retrace of the decline from 6/7.
USDCAD 4 HOUR
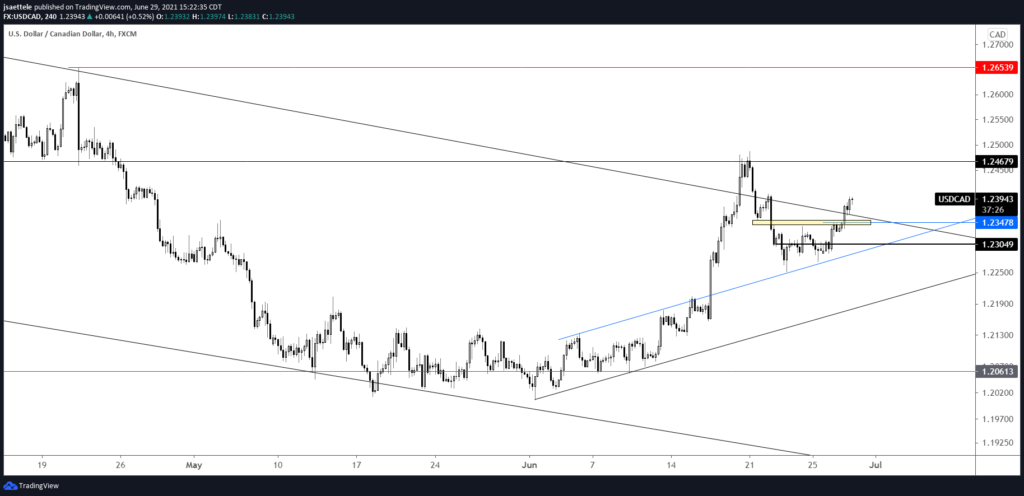
The only change to USDCAD is that I’m moving proposed support for bullish entry slightly higher to 1.2340s. That level has been support and resistance on multiple occasions since 6/21. Upside focus remains 1.2653-1.2721.
6/28 – USDCAD continues to hold above support defined by former short term channel resistance (blue line). The drop also consists of 2 equal waves. Focus is higher as long as price is above last week’s low of 1.2253. 1.2305 is proposed support. The next upside level of interest is 1.2653-1.2721. This is the April high and year open. The 200 day average is between these levels.
EURUSD WEEKLY
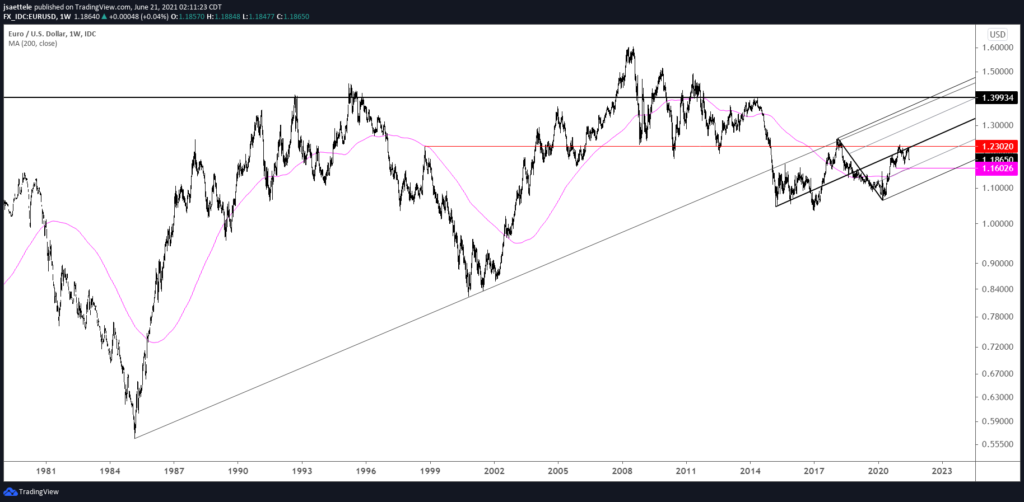
‘Thinking’ that long term trend has turned up but the rally from March 2020 has only led to a test of the well-defined 1.2300. Pay attention to 1.1600, which is possible support for the next long opportunity.
DXY WEEKLY
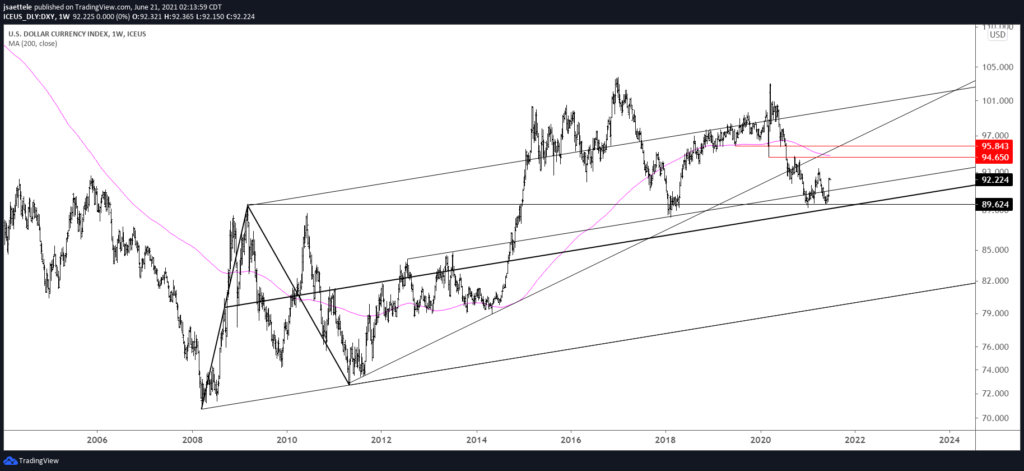
If the longer term trend is down then 94.60s-95.80s (underside of former supporting trendline) is key resistance.
GBPUSD WEEKLY
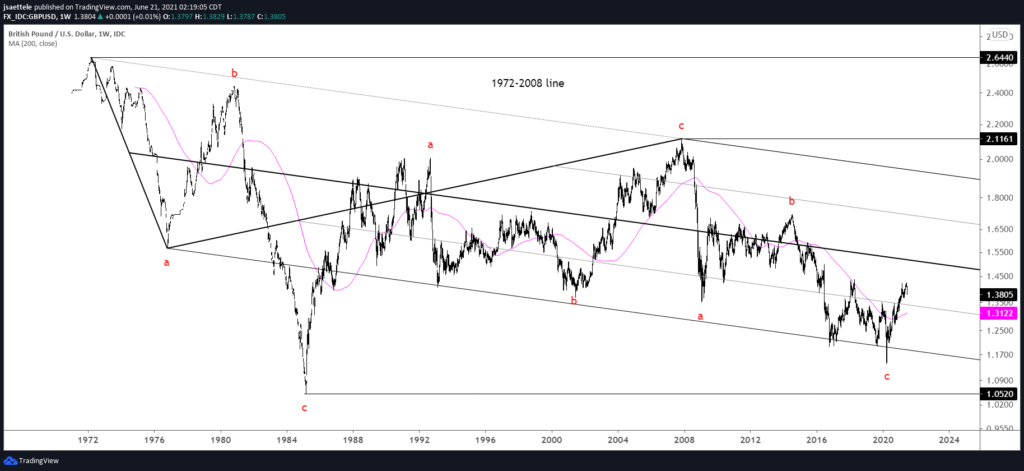
Double bottom setup with the 2016 and 2020 lows but allow for a bigger shakeout before another attempt at a breakout. Former highs at 1.3400-1.3500 are now possible supports.
USDJPY WEEKLY
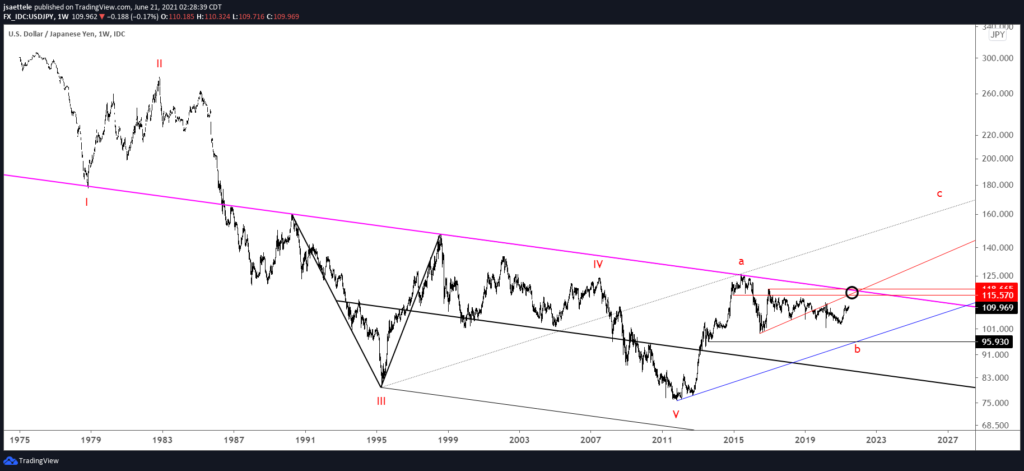
I’m thinking that everything since the 2015 high is huge B wave that could reach 95-96 but a test of 115-118 is still possible beforehand.
AUDUSD WEEKLY
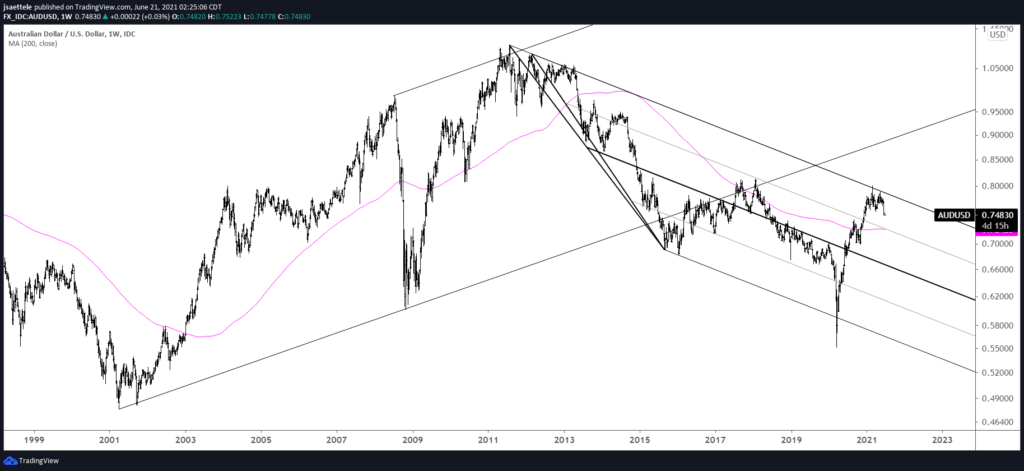
AUDUSD has spanned the channel from the 2011 high since the March 2020 low! Initial support is .7240 or so. Failure to hold there opens up the center line, which was previously resistance. That line isn’t until a .6600 handle.
NZDUSD WEEKLY
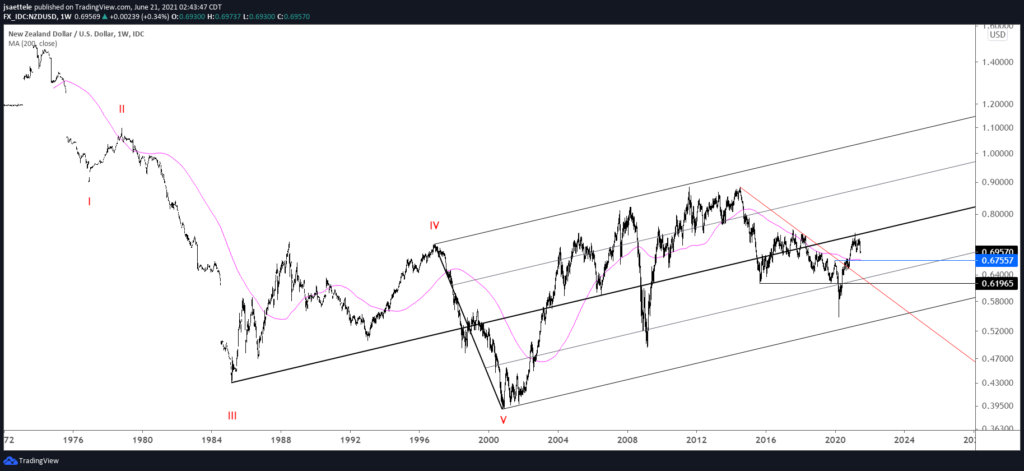
NZDUSD has pulled back from the median line of the structure that originates at the 1985 low! Initial support is .6750. The top side of the line off of the 2014 and 2018 highs may be more important support near .6300.
USDCAD WEEKLY
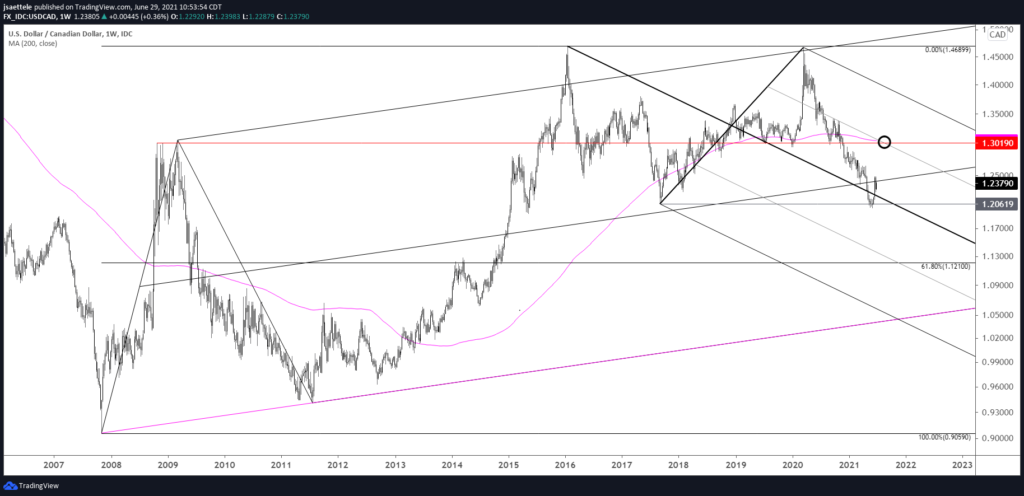
A double top is in play with the 2016 and 2020 highs (similar to the double bottom in GBPUSD) but allow for the shakeout with resistance centered on 1.3000.


