Market Update: December 20
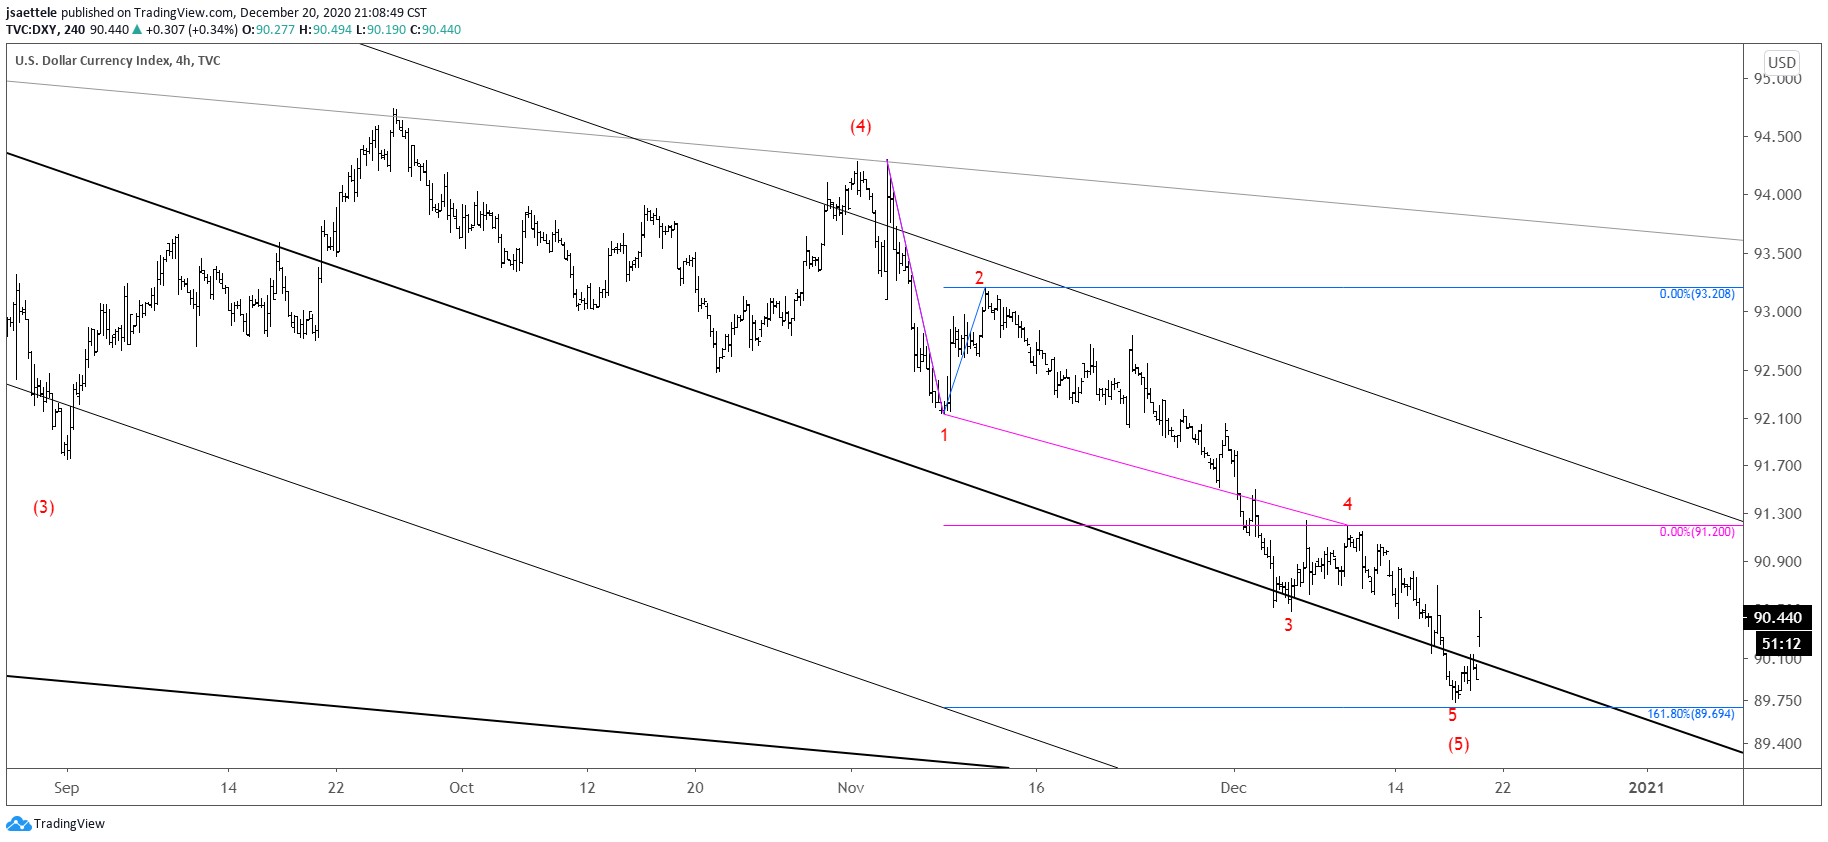
DXY 4 HOUR

DXY is up sharply in early week trading, raising the specter that wave ‘5 of 5’ is complete at last week’s low. If the rally stretches into 5 waves, then focus will be on buying a small pullback for what likely proves to be a multi-month rally in order to correct the entire decline from the March high. Stay tuned.
12/17 – I’m zooming in on DXY action from the November high. The decline is in 5 waves at its current juncture and there are 2 levels to pay attention to. The first is 89.69, which is where waves 3-5 equal 161.8% of wave 1. The second level is 89.03, which is where wave 5 equals wave 1. The lower level is closer to the longer term median line that originates at the January 2017 high. We’re close!
EURUSD HOURLY

EURUSD analysis is the same as DXY…just in reverse. A 5 wave drop from the high would present a bearish opportunity on a small bounce. Levels to watch over the next day or so are the short term center line near 1.2150 for a bounce and 1.2220s for resistance. The big test for bulls on a swing basis is the lower parallel near 1.2040.
12/17 – EURUSD is just above 1.2250 and appears headed for the test of the noted upper parallel from the channel that begins at the March low. That line is still about 1.2330. A tag of this level before a more meaningful pullback would make sense given that the more important DXY level appears to be 89.03.
GBPUSD WEEKLY

Cable has nearly erased all of last week’s rally already. Once again, the massive 1.3500 level has proved itself as important resistance. Broad downside focus is 1.2676 (former 4th wave of one less degree) but near term downside focus is the line off of the September and November lows near 1.3100 (see below). Proposed resistance is 1.3440.
GBPUSD 4 HOUR

USDCAD 4 HOUR

USDCAD has broken above the mentioned 1.2800 and immediate focus is 1.2920/50. Strength above there would open up 9 month trendline resistance near 1.3100. The top side of the just broken trendline should provide support now near 1.2792.
12/16 – USDCAD has bounced from the line noted yesterday. Strength above 1.2800 would warrant a short term constructive view with focus on 1.2950.
NZDUSD 4 HOUR

Kiwi has turned down following the test of .7152. Remember, this is the 50% retrace of the decline from the 2014 high…the low was in March! Price is testing short term trendline support now. If price breaks below, then watch for the underside of the line to provide resistance in order to establish a short position.
12/16 – No change to NZDUSD analysis and levels. The 50% retrace of the decline from the 2014 high at .7152 remains in focus for possible resistance and a drop under .7000 is needed in order to suggest that a reversal is underway.


