Market Update: December 17
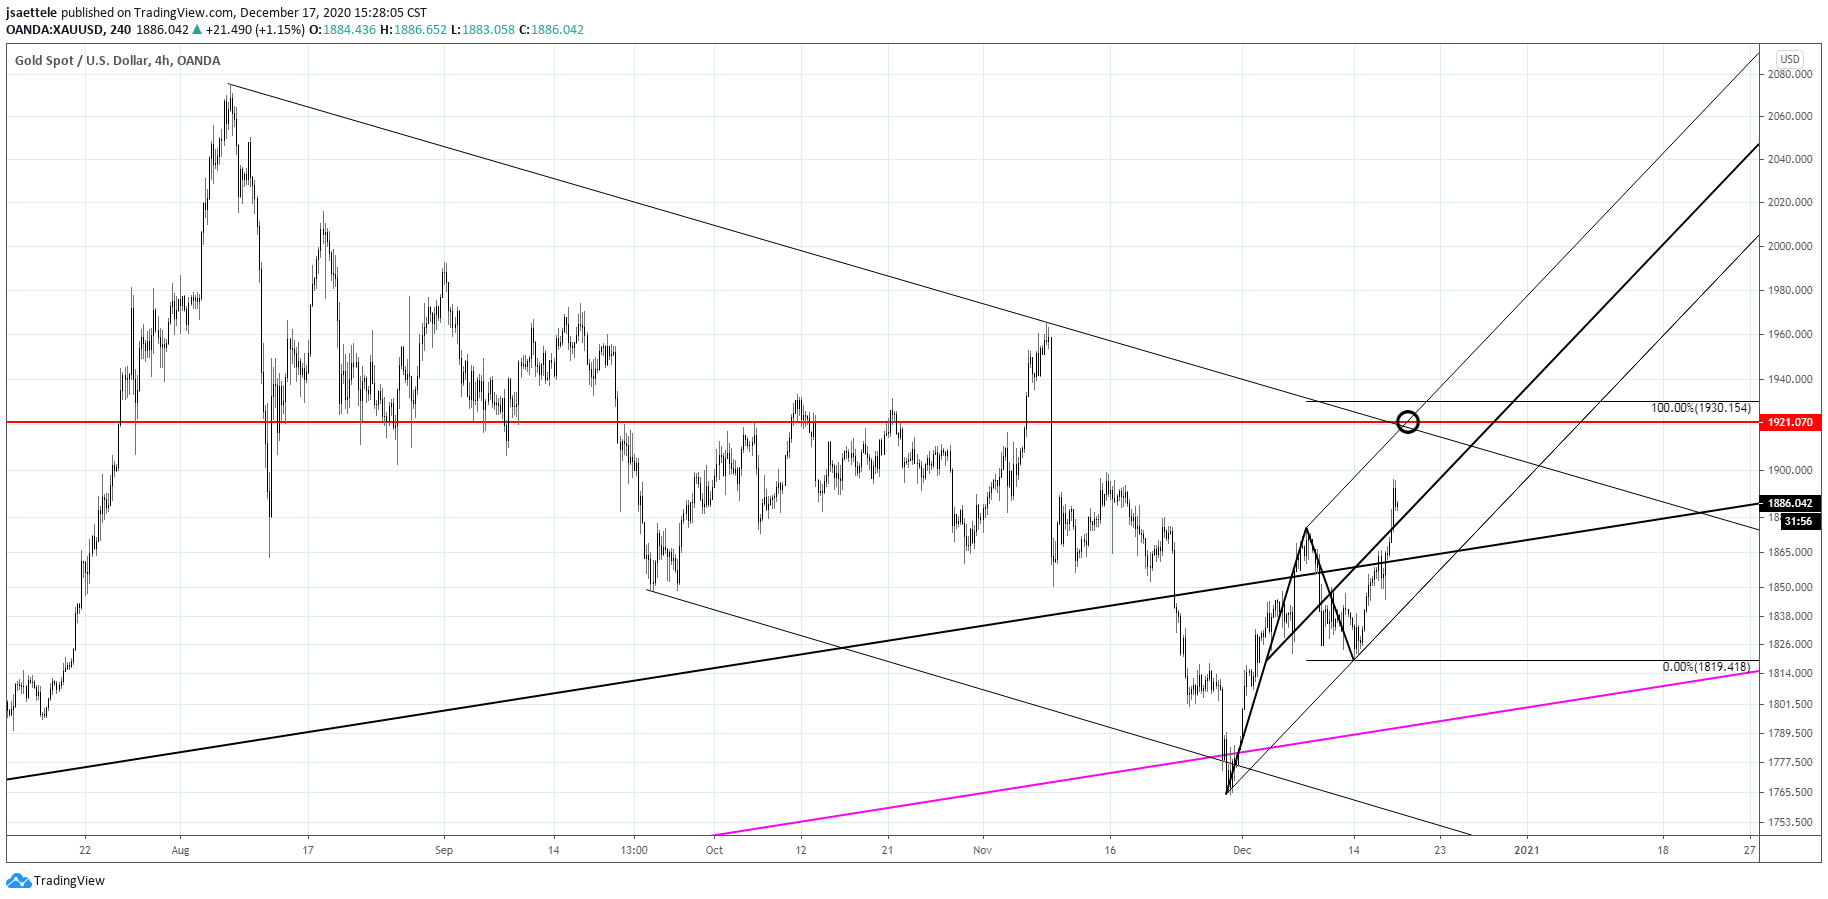
GOLD 4 HOUR

Gold pulled back to 1819 before resuming higher. The next level of interest is 1921/30. This is the 2011 high, 2 legs up from the low, and a slope confluence (short term bullish upper parallel and medium term bearish upper parallel).
12/6 – Gold has traded into proposed resistance. I’m ‘thinking’ pullback here with proposed support near 1800.
SILVER 4 HOUR

Silver has broken out. The series of lower highs and lower lows since August is no longer. I favor buying weakness with proposed support at 24.86-25.07. The next upside level of interest is the 9/15 high at 27.63.
USDOLLAR DAILY

The USD continues to get absolutely destroyed. The 2015 and 2016 lows are 11634/81 (highlighted). The lower end of the zone is in line with a parallel so I’m focusing on this level as support.
DXY 4 HOUR

I’m zooming in on DXY action from the November high. The decline is in 5 waves at its current juncture and there are 2 levels to pay attention to. The first is 89.69, which is where waves 3-5 equal 161.8% of wave 1. The second level is 89.03, which is where wave 5 equals wave 1. The lower level is closer to the longer term median line that originates at the January 2017 high. We’re close!
EURUSD 4 HOUR

EURUSD is just above 1.2250 and appears headed for the test of the noted upper parallel from the channel that begins at the March low. That line is still about 1.2330. A tag of this level before a more meaningful pullback would make sense given that the more important DXY level appears to be 89.03.
12/16 – EURUSD remains in the latter stages of the impulsive rally that began at the March low. There are 2 levels to pay attention to; 1.2250 and about 1.2330. The first level is the upper parallel from the channel that originates at the November low. The second level is the upper parallel from the channel that begins at the March low. A drop under 1.2125 would suggest that a top of sorts is in place and immediate focus would then shift to 1.2011. A shorter term chart is below.
AUDUSD DAILY

AUDUSD reached the noted .7637 today (basically trading there now) but there is no sign of a reversal to this point. I’m showing a zoomed in version of the chart from yesterday’s post. The line off of the 2008 and 2015 lows (red line) is about .7675, which is also the high from June 2018. Focus on that level for a reversal. Also, daily RSI is above 78. The next 3 charts show all instances of this occurring over the last 20 years.
12/16 – Be aware of .7637 in AUDUSD for possible resistance. This is the 38.2% retrace of the decline from the 2011 high. The line that extends off of the 2008 and 2015 lows (red line) is near there as well. This line was a useful reference point during the second half of 2018 (highlighted).
AUDUSD DAILY

AUDUSD DAILY

AUDUSD DAILY


