
Market Update 10/25 – Gold Breakout
NASDAQ FUTURES (NQ) DAILY
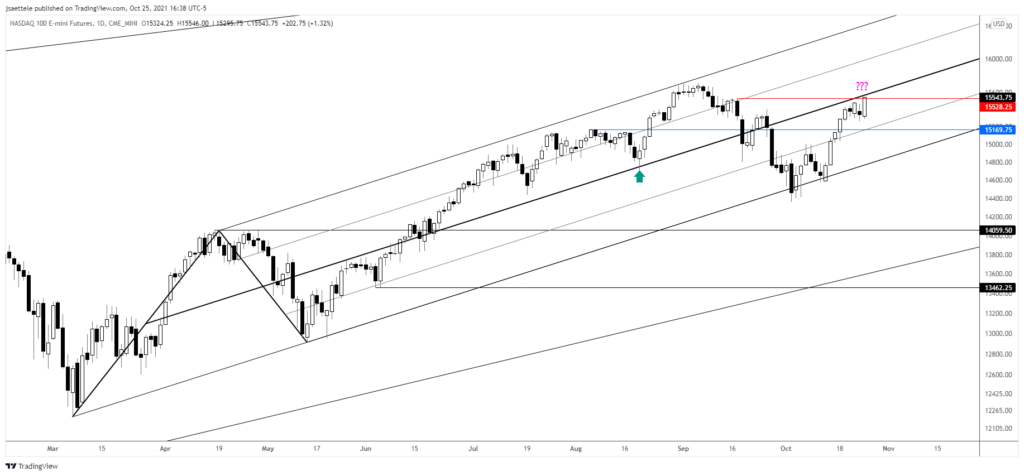
FX volatility should pick up later in the week with BoC, BoJ, and ECB. There are some interesting developments to note however in other asset classes after today’s action. NQ surged into possible resistance from the underside of the center line from the channel that originates at the March low. Note too that a non-confirmation remains in place with the S&P at an all-time high. I’m looking for a pullback (for now) with 15170 as possible support.
CRUDE OIL FUTURES DAILY
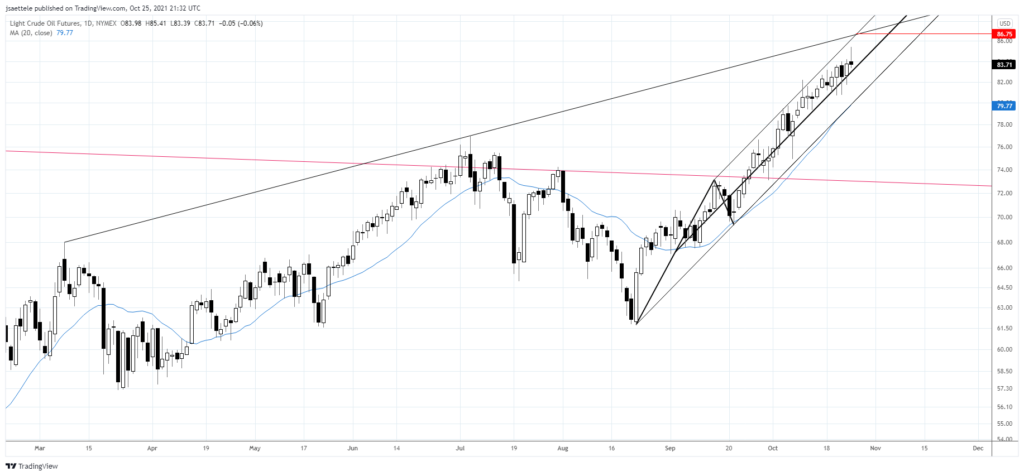
Crude reversed lower today although requirements for a volume reversal were not met. As such, I’m not confident in fading this rally yet but be aware of a slope confluence near 86.75 for resistance. If price does trade lower from the current level then pay attention to channel support and the 20 day average, currently near 79.80, for support.
SPOT GOLD DAILY
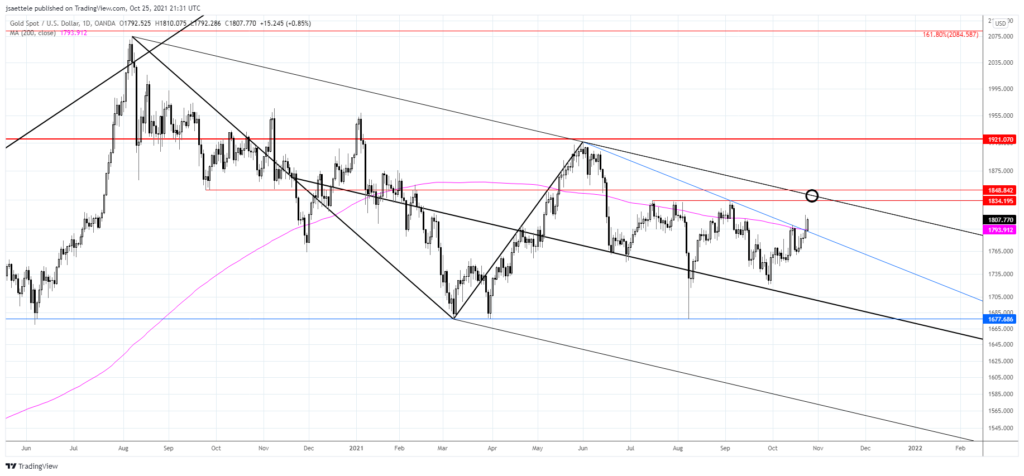
Gold broke above trendline resistance and the 200 day average today. The top side of the trendline (blue) is now proposed support near 1790. Upside focus is the line off of the August 2020 and June high. That’s about 1840.
USDJPY 4 HOUR
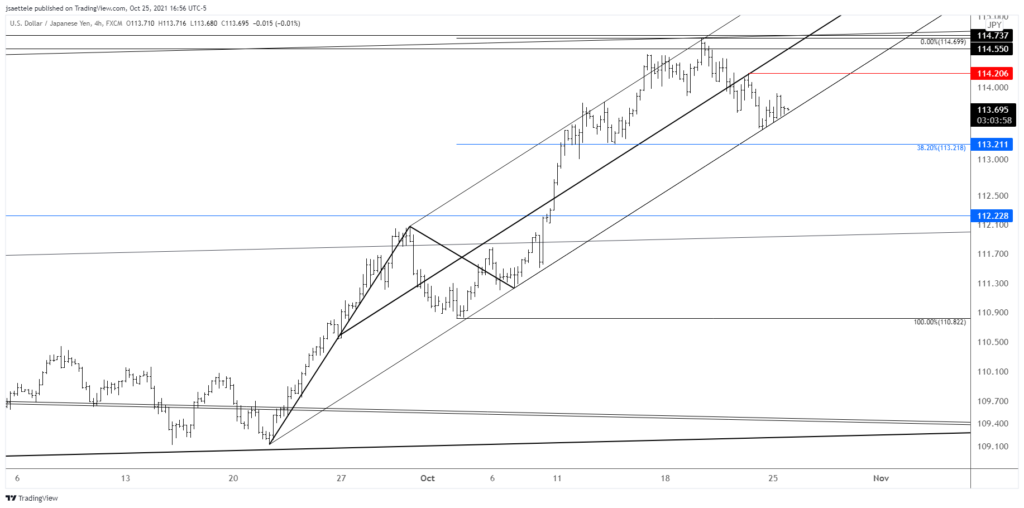
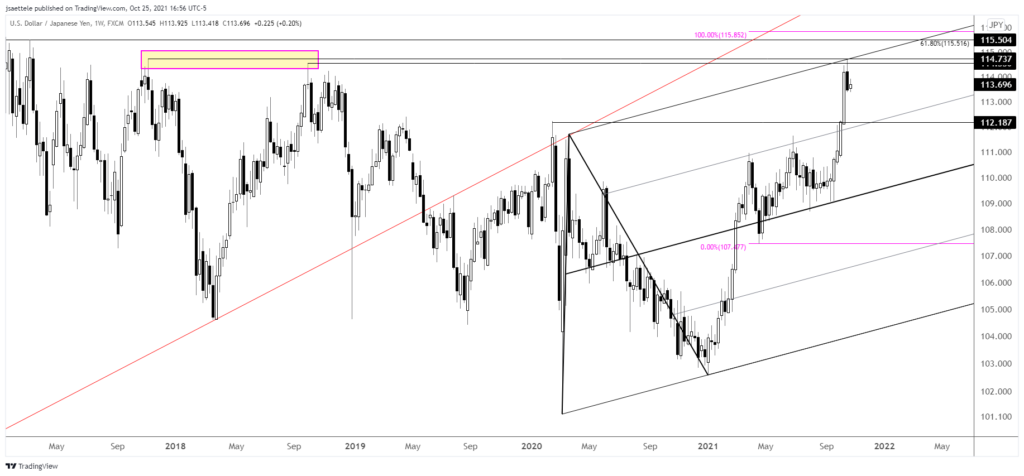
The break higher in gold is interesting when considering USDJPY. JPY and gold tend to trade together so perhaps last week’s reversal in USDJPY is ‘for real’ (see weekly chart below). Price is sitting on short term channel support right now. If price breaks below, then I’ll look to short a bounce into the underside of that line. For now, possible short term pivots are 114.20 and 113.20.
10/18 – USDJPY has nearly reached the noted zone so pay attention. Aside from channel resistance, the level just above the market is defined by the late 2017 and 2018 highs at 114.55/74. A pullback from the zone would ‘make sense’. If reversal evidence arises, then there may be an opportunity to play the short side although 113.21 is in line for support (see below).
USDJPY WEEKLY
EURUSD HOURLY
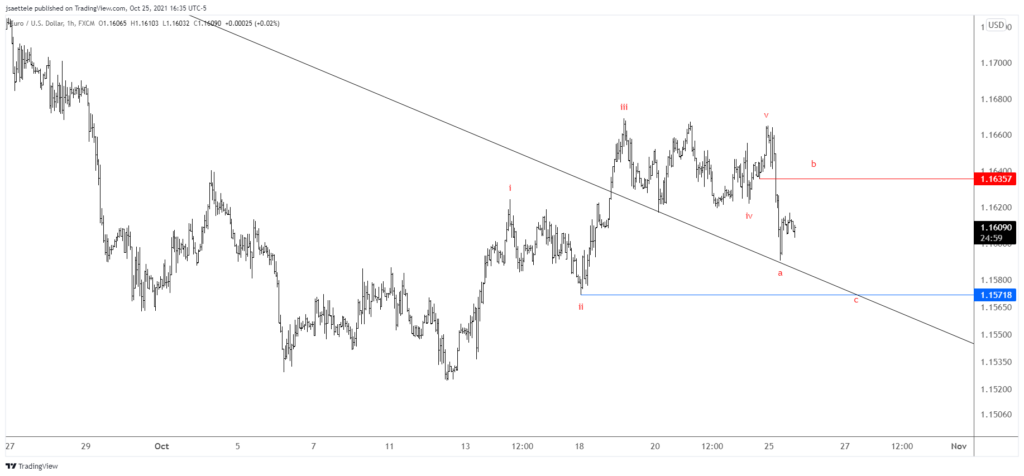
The EURUSD wave count is updated to reflect the wave 4 triangle. My thinking is that today’s drop is wave A within the A-B-C drop so watch for a wave B bounce into 1.1635 or so before a final C wave drop into 1.1570. This could happen later this week on ECB!
10/21 – The EURUSD rally from last week’s low satisfies requirements for a 5 wave impulsive advance. Wave 4 cannot overlap wave 2 is an Elliott impulse rule. R.N. Elliott plotted his charts on hourly closing data…so the rules should be interpreted on hourly closing data! As such, I’m treating the rally as an impulse and looking for a 3 wave pullback before another leg higher. Proposed support is 1.1570/80.


