Market Update: January 24
HEDGE FUND LEVERAGE ALL-TIME HIGH
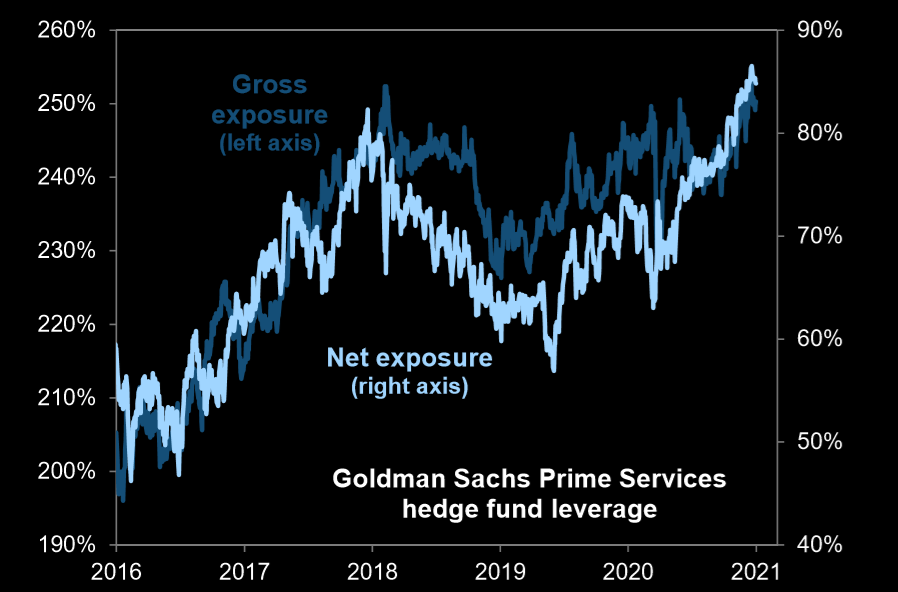
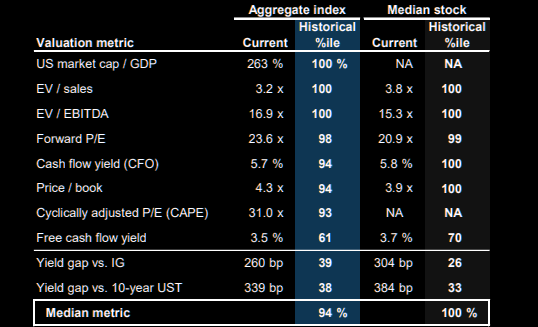
First, a few ‘techamental’ charts to convey the degree of extreme speculation at present.
EQUITY VALUATION METRICS ARE HISTORICALLY EXPENSIVE
SPOT SILVER 4 HOUR
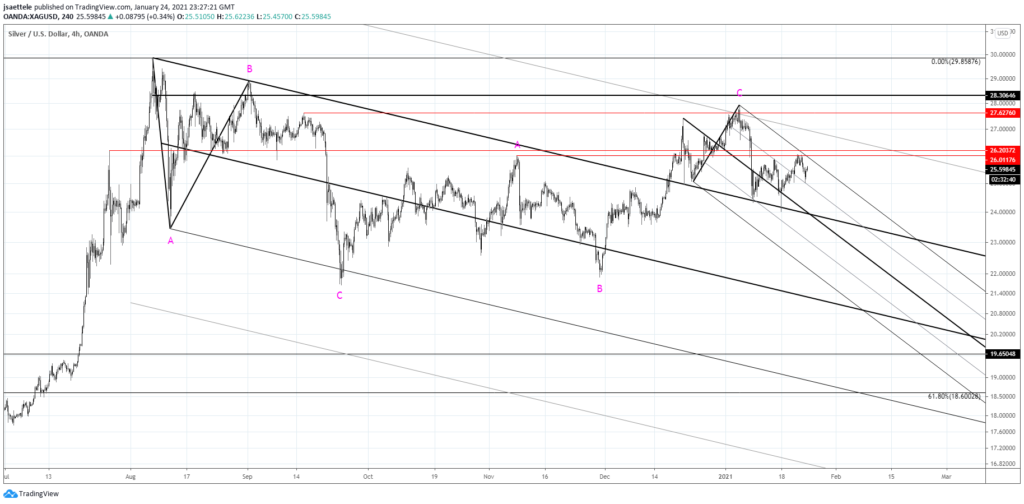
Silver traded up to proposed resistance last week and tanked on Friday. Previous comments regarding the complex correction scenario from the August high remain. In other words, focus is lower. The big test for downside is probably about 23.70.
1/19 – Silver tumbled from the 25 line of the short term bearish fork before rebounding from the top side of former trendline resistance turned support. This line has been support on each dip since late December…clearly an important level. I continue to favor the complex correction scenario and proposed resistance is 26.01/20 (horizontal red lines).
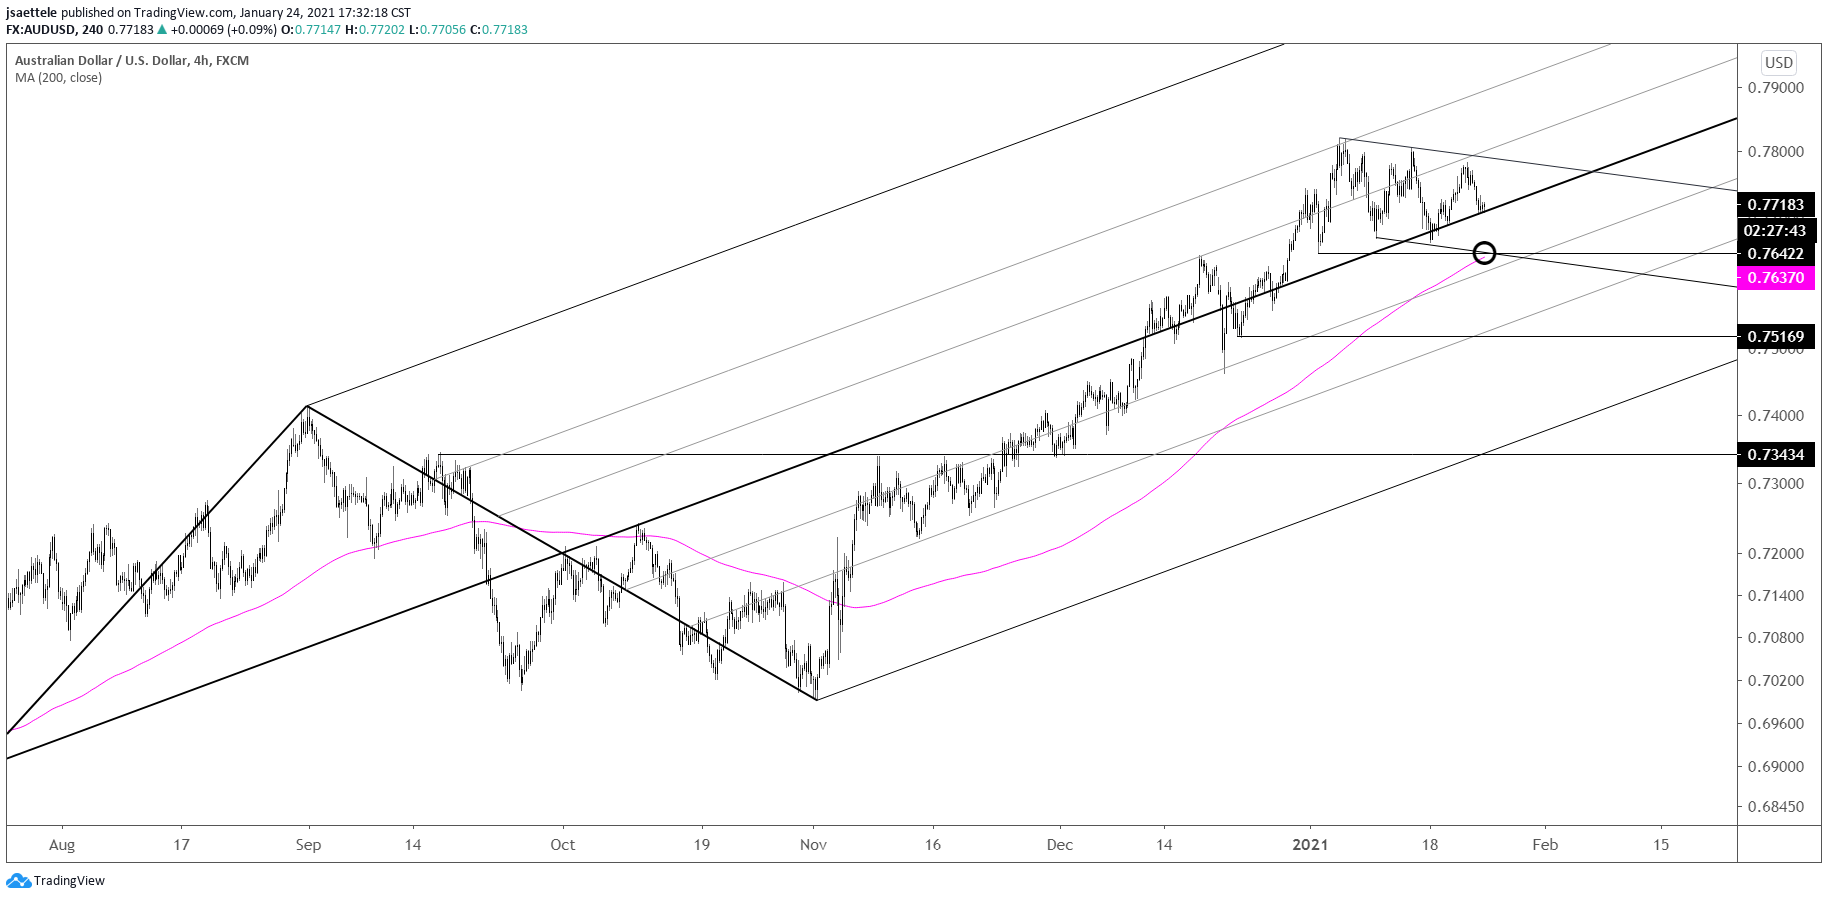
AUDUSD 4 HOUR
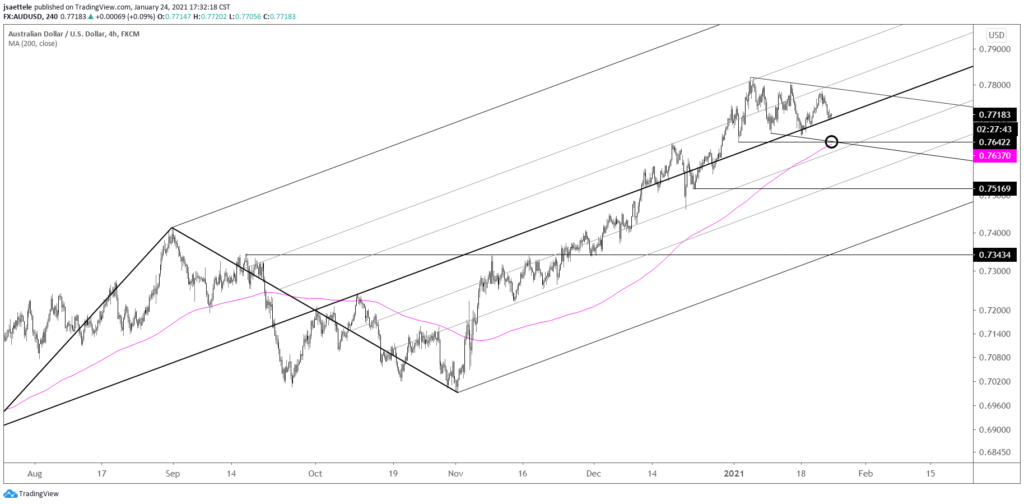
AUDUSD is testing the median line from the Schiff fork that originates at the March low. This is a key spot. A break below would indicate an important behavior change and immediate focus would be the lower parallel of the short term bearish channel at .7642. In the event of a break below, the underside of the median line would become proposed resistance.
1/21 – .7740 failed to hold as resistance and the last level before the high that could provide resistance is about .7790. The level is defined by the line off of the highs and the parallel that was resistance on 12/17 (circled).
USDJPY 4 HOUR
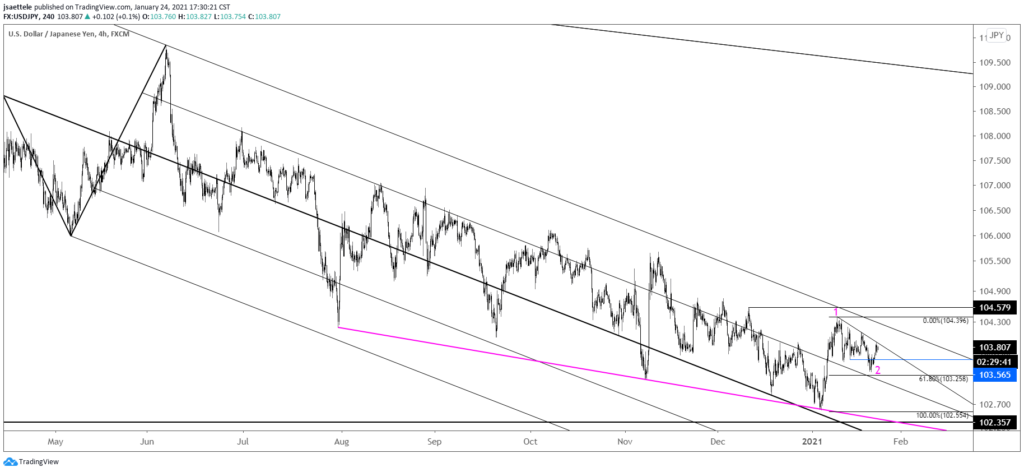
The USDJPY pullback, probably a 2nd wave within a bull cycle from the 1/6 low, resembles a small wedge. As such, I’m treating last week’s low at 103.33 as the bottom of wave 2. There is a high volume level at 103.55 that is now proposed support. A break above 104.40 would suggest that wave 3 higher is underway.
1/21 – USDJPY low today was 103.33…close enough for government work but there is no reason to hurry and buy USDs given that DXY support is a bit lower and the USD has been a one way train (down) since March. So, continue to pay attention to 103.20s for support and the next low.

