Market Update: January 21
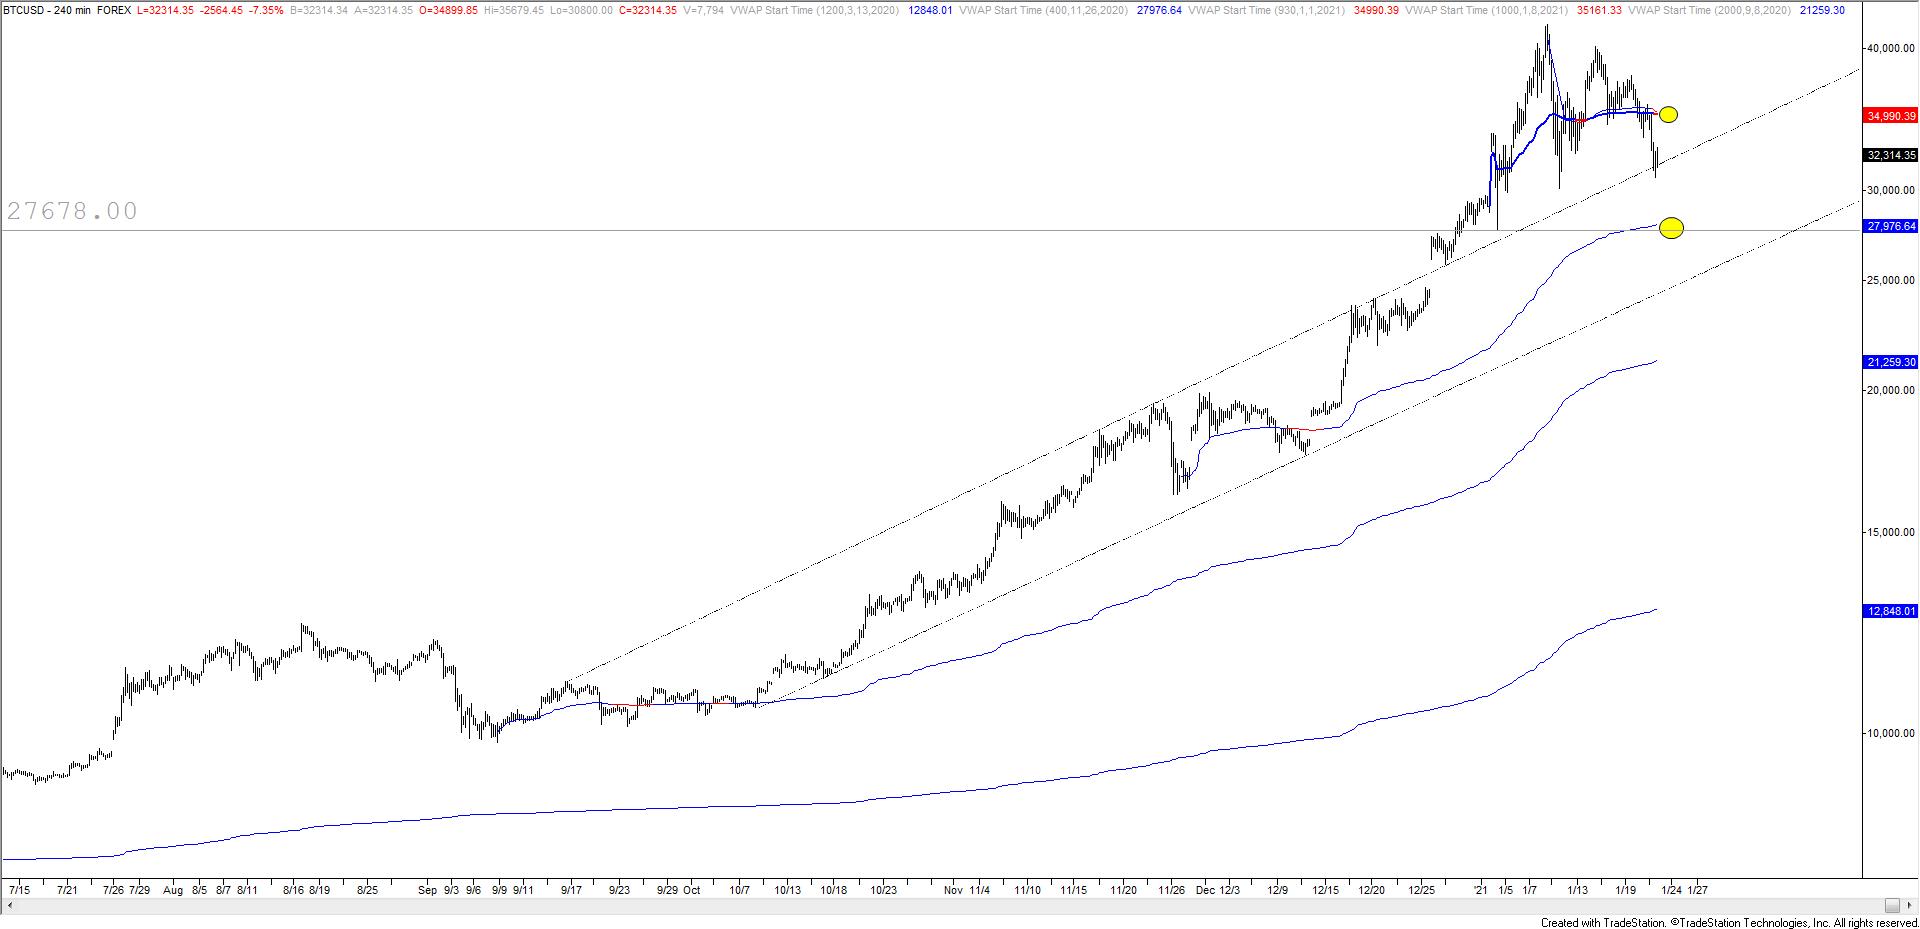
BTCUSD 4 HOUR

BTCUSD has turned down sharply following last week’s 2 bar weekly volume reversal. If you want to play in this sandbox, then pay attention to 35000 for resistance and 28000 for the next bounce level. The latter level is a spike low and VWAP from the November low. The former level is defined by VWAP from the high and 2021 VWAP.
1/18 – BTCUSD made a 2 bar weekly volume reversal last week. TradeStation historical is limited but this is the 2nd 2 bar weekly volume reversal since 2019. The 2019 signal identified an important top. Bitcoin news mentions have also gone parabolic (see below). This isn’t a surprise but it’s comforting to see the data. In other words, the speculative excess isn’t anecdotal.
DXY 4 HOUR

DXY is nearing the noted 61.8% retrace of the rally at 89.87. The level is also defined by the lower parallel of the short term bullish fork. If this level doesn’t hold, then there is no reason to be constructive DXY. The COT chart below shows that speculative short positions are their largest since 2007 (there are a couple hundred more short positions now than at the 2011 low).
1/20 – The short term median line continues to act as resistance and the 25 line continues to act as support in DXY. If price fails to hold here then the 61.8% retrace at 89.87 is possible support. The upper parallel from the Schiff fork off of the March high was resistance last week. A break above would be significant. Until then, the USD bounce is just that…a bounce.
U.S. DOLLAR INDEX COT WEEKLY

EURUSD HOURLY

EURUSD is nearing the mentioned 1.2180s. The rally from this week’s low would consist of 2 equal legs at 1.2181. The spike during ECB today tested the upper parallel of the corrective channel. A zoomed out chart is shown below and the futures chart with VWAPs are 2 charts down. The VWAP levels reinforce proposed resistance at the noted level. If EURUSD is going to turn down then there is no better spot than from 1.2180s (give or take).
1/19 – EURUSD is just above the level that was noted for resistance yesterday (1.2130). A bit more strength to test 1.2180s remains possible before weakness resumes. The level is defined by the underside of a parallel that has been support since August (think polarity…support turned resistance!) and the 200 period average on the 4 chart. Oh, it’s also near VWAP from the high (see below).
EURUSD 4 HOUR

EURO FUTURES HOURLY

AUDUSD 4 HOUR

.7740 failed to hold as resistance and the last level before the high that could provide resistance is about .7790. The level is defined by the line off of the highs and the parallel that was resistance on 12/17 (circled).
1/19 – AUD futures made a weekly volume reversal last week. Weekly volume reversals are indicated with red and blue bars on the chart. All signals except 1 (last March) identified at least near term price extremes. ‘Ideal’ resistance is .7740 (see hourly spot and futures charts below).
USDJPY HOURLY

USDJPY low today was 103.33…close enough for government work but there is no reason to hurry and buy USDs given that DXY support is a bit lower and the USD has been a one way train (down) since March. So, continue to pay attention to 103.20s for support and the next low.
1/20 – No change to USDJPY. I’m looking to either play a breakout above 104.40 or buy a hold near 103.25. BoJ is tonight.
USDTRY 4 HOUR

USDTRY didn’t quite make it to 7.56 but price is respecting the bearish channel perfectly so I’m going to leave a short order on the downward sloping trendline, which is near 7.4380. A downside objective is where the decline from the top would consist of 2 equal legs from the top at 6.9765.
1/12 – USDTRY has bounced and reached the bottom of the proposed resistance zone. The trendline is slightly higher at about 7.56, which is just under the 200 period average on the 4 hour chart.
GBPJPY WEEKLY

GBPJPY is nearing the upper parallel of the channel from the 2018 high. The line is about 143, which is just above the September high at 142.71. 143 is also the upper parallel of the channel from the September low. I think of channel confluences as ‘energy points’. In other words, expect either a strong rejection and reversal or a strong breakout…don’t expect price to meander around the level.


