Market Update 9/22 – USDJPY is ‘Coiled’ the Most Since 2014
S&P 500 (CASH) DAILY
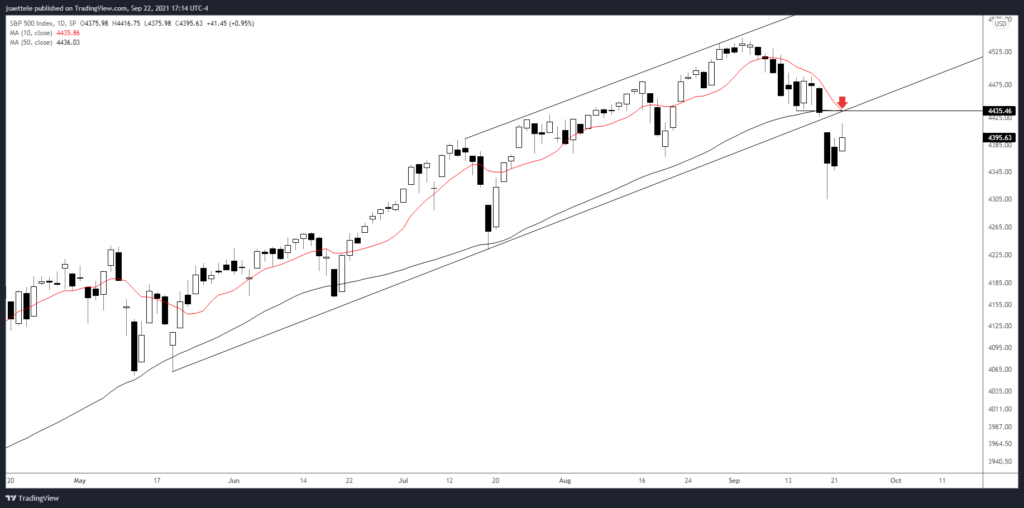
The trend channel on the S&P cash chart is slightly different than on the futures and CFD charts. The underside of the lower parallel on the cash chart comes in near 4435, which is also the 10 and 50 day averages. Keep the level in mind for resistance, especially if we get an up open.
9/20 – SPX broke the channel so the next downside level to pay attention to is the full extension of the width of the channel. That line intersects about 4220 towards the end of the week. The underside of the channel is proposed resistance now near 4395-4400.
EURUSD DAILY
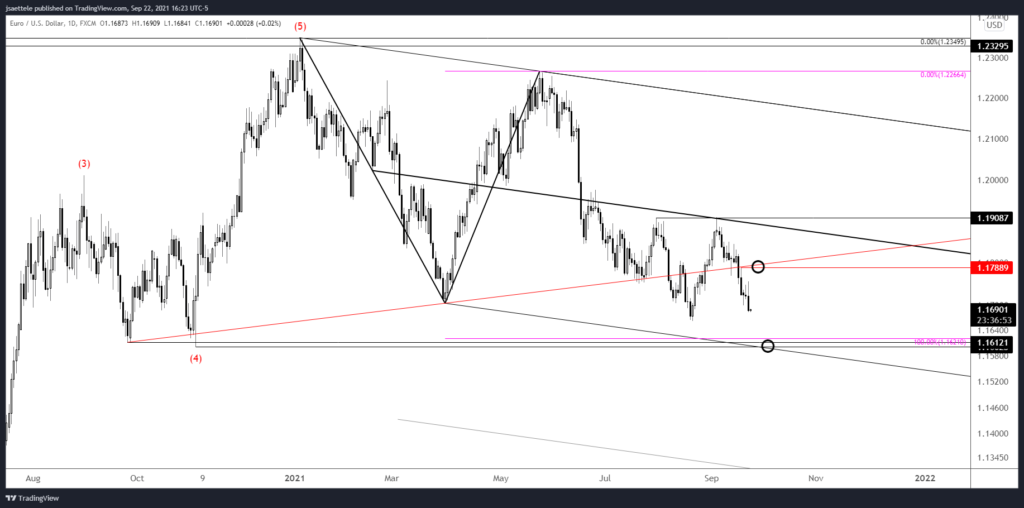
FOMC didn’t change much for EURUSD. I was hoping for a rally into 1.1790 to short but that could still happen. More importantly, be aware of expected support at 1.1600/20. The level is huge. This is the former 4th wave low (Sep 2020 and Nov 2020 election lows) and corrective channel support. The top of the zone is 2 equal legs down from the January high.
9/20 – EURUSD low today was right at daily reversal support (8/20 close) and price put in a doji. The broader pattern isn’t clear but this is a good spot for a small bounce at minimum. Proposed resistance is 1.1790 or so.
USDJPY DAILY
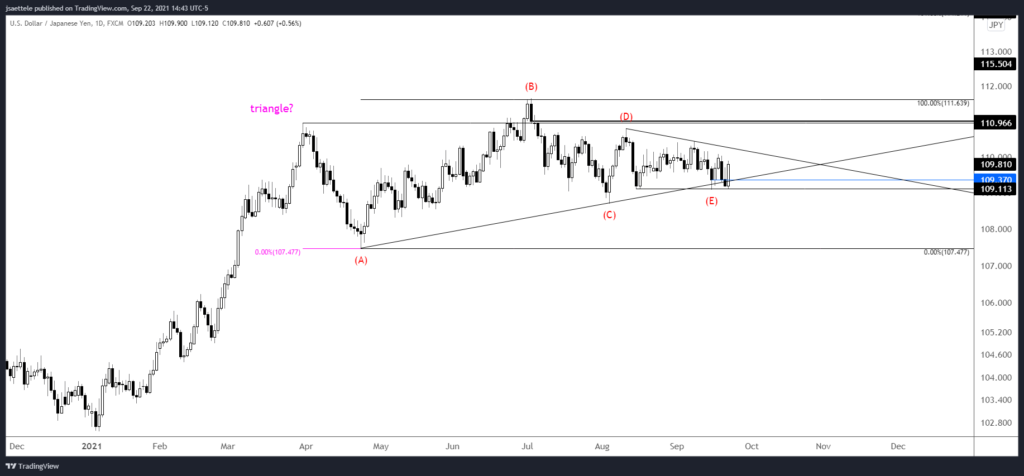
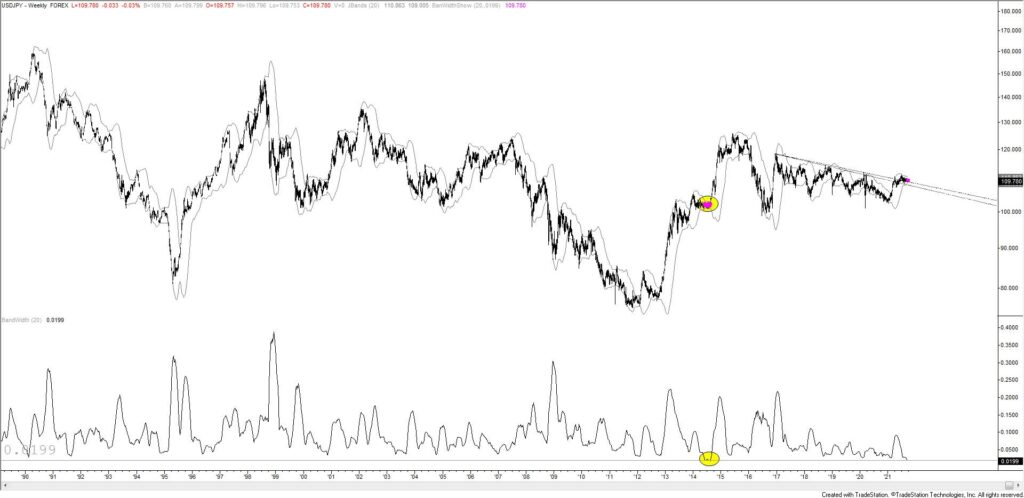
Is USDJPY about to explode higher from a 6 month triangle? Watch for support near 109.37. Within the range, 111.00 is still possible resistance but that’s missing the bigger picture. USDJPY is the most ‘coiled’ since August 2014…right before price went on a 2000 pip run in 4 months. This observation is based on weekly Bollinger Band width (see below). Don’t forget that price is trading above multiyear trendline resistance as well. I’m on breakout alert.
9/16 – USDJPY held the noted line and followed through on the volume reversal (futures…see yesterday’s post). It’s possible that everything since the March high is a triangle that resolves with a breakout higher. As such, I’m bullish here against the 9/15 low at 109.11. Possible range resistance is 110.97.
USDJPY WEEKLY
USDCAD 4 HOUR
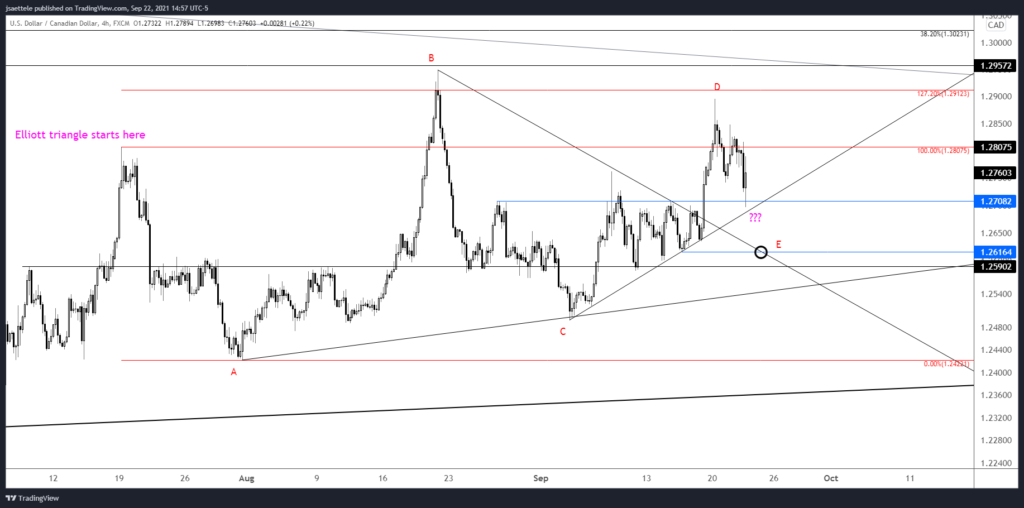
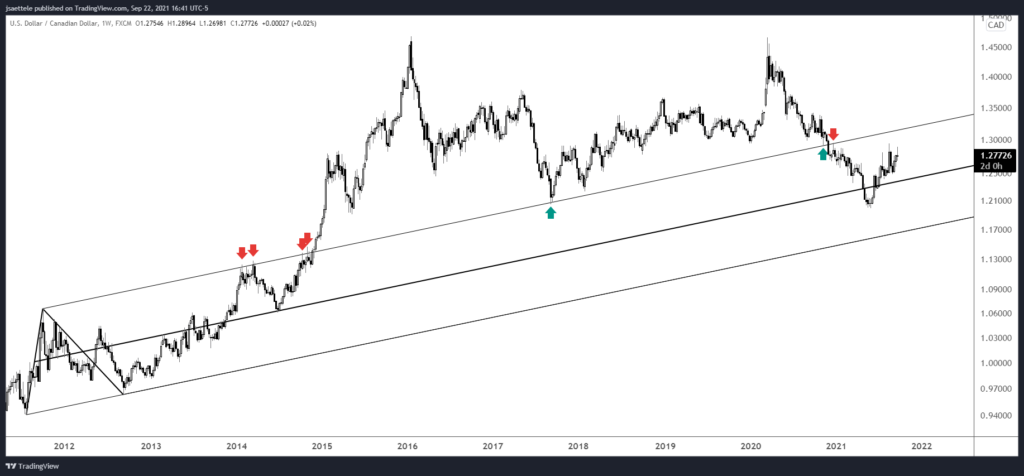
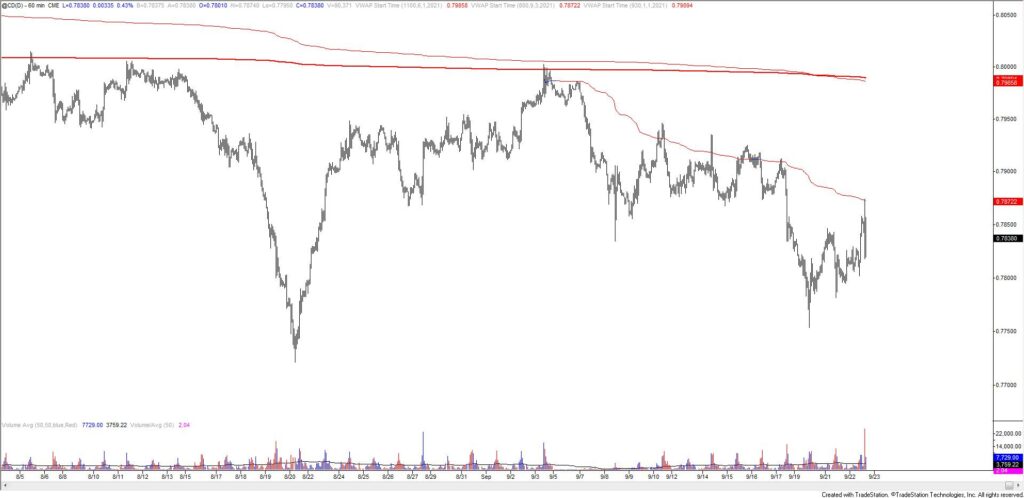
The first proposed USDCAD support level was hit today. I was ‘thinking’ the pullback would be deeper in order to satisfy another 61.8% relationship between alternating legs of the triangle but it’s worth taking a bullish stand against today’s low, especially since VWAP resistance (USDCAD support) was hit today (see below). A breakout would target a long term parallel near 1.3170 (see 2 charts down).
9/21 – 1.2760 was a decent scalp level for USDCAD today but continue to respect the triangle scenario in which price pulls back to 1.2600 or so (ideal level is actually 1.2616) before price turns back up for a breakout attempt. In the event of a shallow E wave within the triangle then 1.2708 would be a candidate for support. Bottom line, I’m looking to buy either 1.2700ish or 1.2600ish. Hopefully, FOMC clears up the situation.
CANADIAN DOLLAR FUTURES HOURLY
USDCAD WEEKLY
