Market Update 9/23 – USDJPY Breakout
EURUSD 4 HOUR
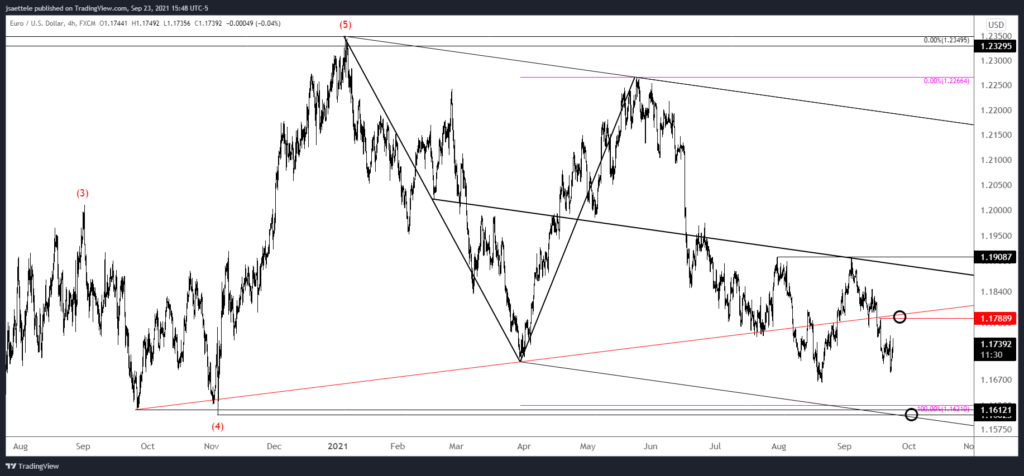
There is absolutely no change to EURUSD. The only reason I’m re-posting the chart is in order to juxtapose EURUSD with USDCHF and USDSEK in order to convey the important test for European FX in general against the USD (it makes sense that the Ryder Cup is this weekend!). Again, 1.1790 is key resistance.
9/22 – FOMC didn’t change much for EURUSD. I was hoping for a rally into 1.1790 to short but that could still happen. More importantly, be aware of expected support at 1.1600/20. The level is huge. This is the former 4th wave low (Sep 2020 and Nov 2020 election lows) and corrective channel support. The top of the zone is 2 equal legs down from the January high.
USDCHF DAILY
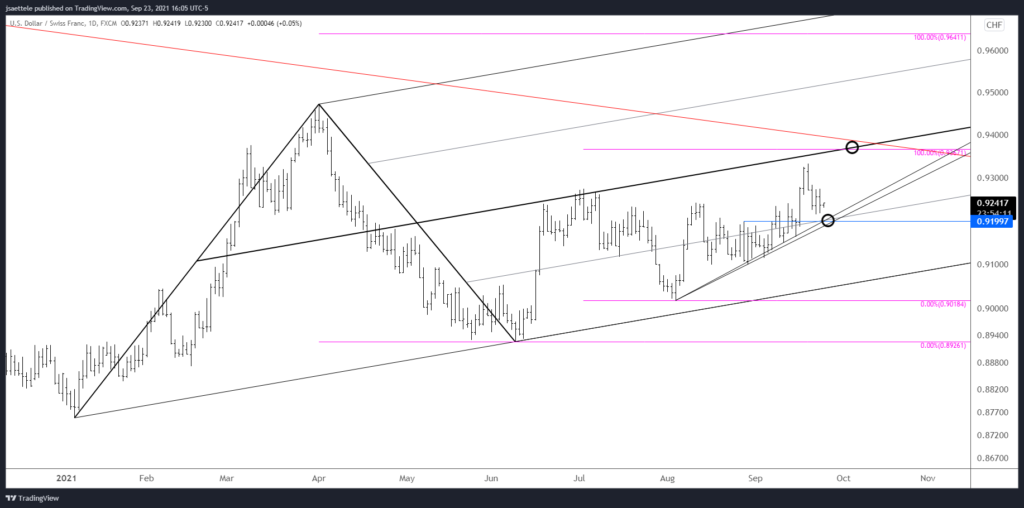
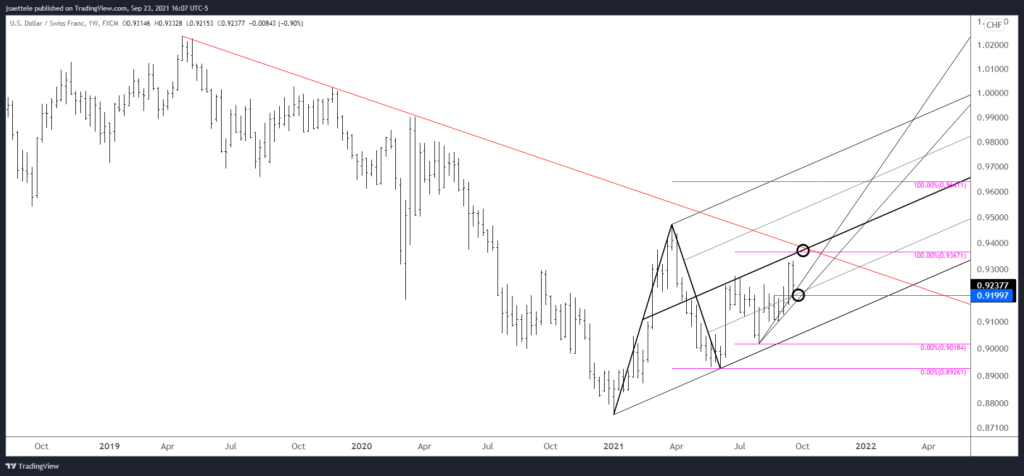
.9200 is key support for USDCHF. The level is defined by the 8/27 high and trendline support from the August low. Upside focus remains where the rally from June would consist of 2 equal legs at .9367. This is also 2+ year trendline resistance (see below).
USDCHF WEEKLY
USDSEK DAILY
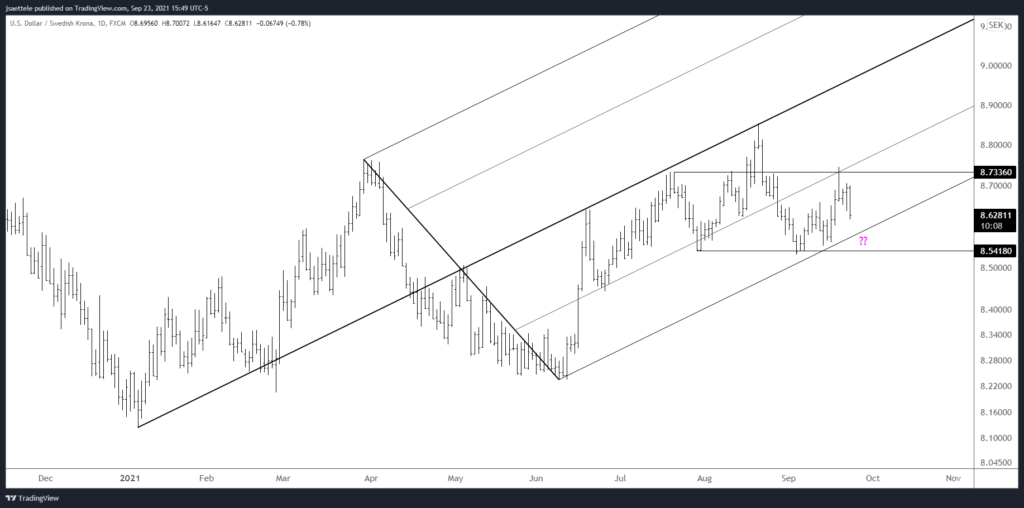
USDSEK continues to trade in a textbook manner with respect to the 2021 pitchfork (originates at the January low). The median line was perfect resistance in June, July, and August. The 25 line was support in June and July and just provided resistance on Monday (former support providing resistance…aka polarity). The lower parallel is in line for support now near 8.5765.
9/20 – Another reason to suspect a EURUSD bounce is the strong USDSEK reaction from noted resistance. There is nothing to suggest that the broader trend isn’t still higher. As long as price is within the 2021 bullish fork, the broader trend is seen as bullish. However, a pullback here makes sense as well with support near 8.64.
GBPUSD 4 HOUR
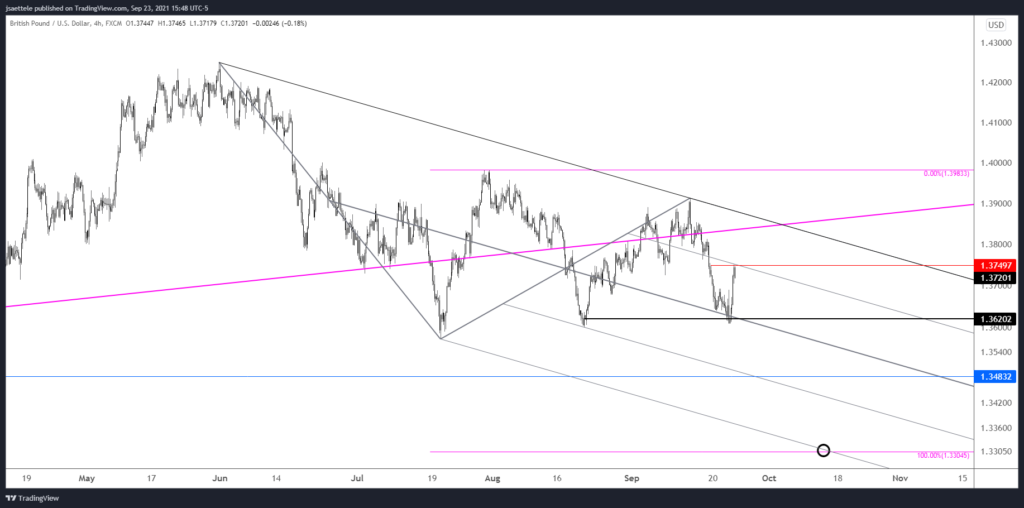
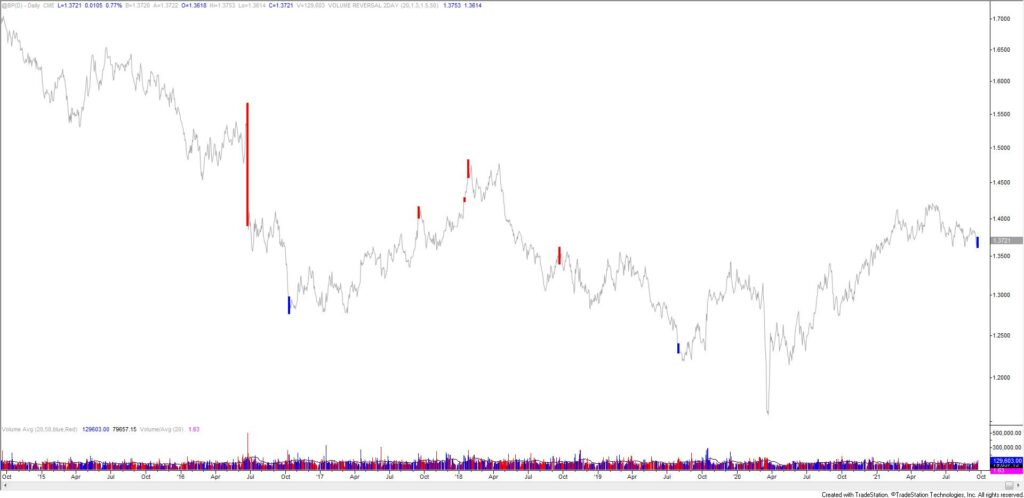
As suspected, GBPUSD bounced from near 1.3628. Price has already reached 1.3750. While this is proposed resistance, confidence in immediate downside is low given the ‘thinking’ that USD support is slightly lower against other European currencies. Also, a 2 day volume reversal triggered today (see below). I”m content to observe until the picture clears up.
9/21 – Cable is a bear but price could bounce from 1.3628, which is daily reversal support and the center line of the channel from the June high. If price does bounce, then proposed resistance is 1.3730/50. If price breaks below the center line, then the underside of the center line becomes proposed resistance in order to add to the short position. The next downside level of interest is the September 2020 high at 1.3483…then the measured level noted yesterday at 1.3305.
BRITISH POUND FUTURES DAILY
USDCAD 4 HOUR
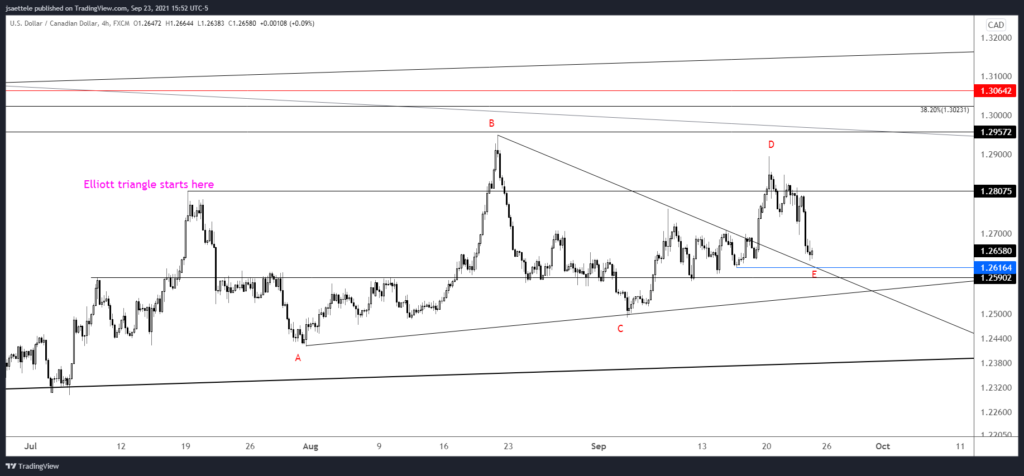
If the USDCAD triangle interpretation is correct then 1.2616 or so should provide support. This is where proposed wave E would equal 61.8% of proposed wave C (common relationship between alternating legs in a triangle), the 9/16 low, and the top side of the line that crosses recent highs.
9/22 – The first proposed USDCAD support level was hit today. I was ‘thinking’ the pullback would be deeper in order to satisfy another 61.8% relationship between alternating legs of the triangle but it’s worth taking a bullish stand against today’s low, especially since VWAP resistance (USDCAD support) was hit today (see below). A breakout would target a long term parallel near 1.3170 (see 2 charts down).
USDJPY DAILY
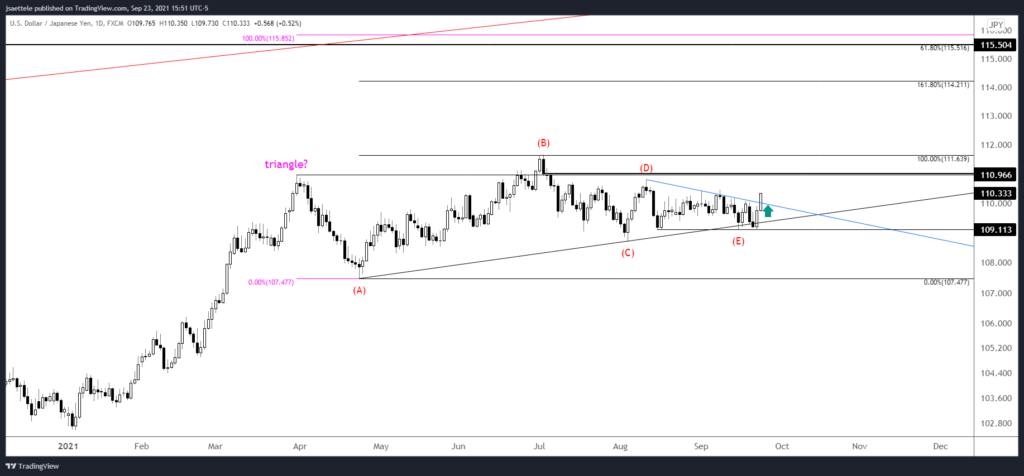
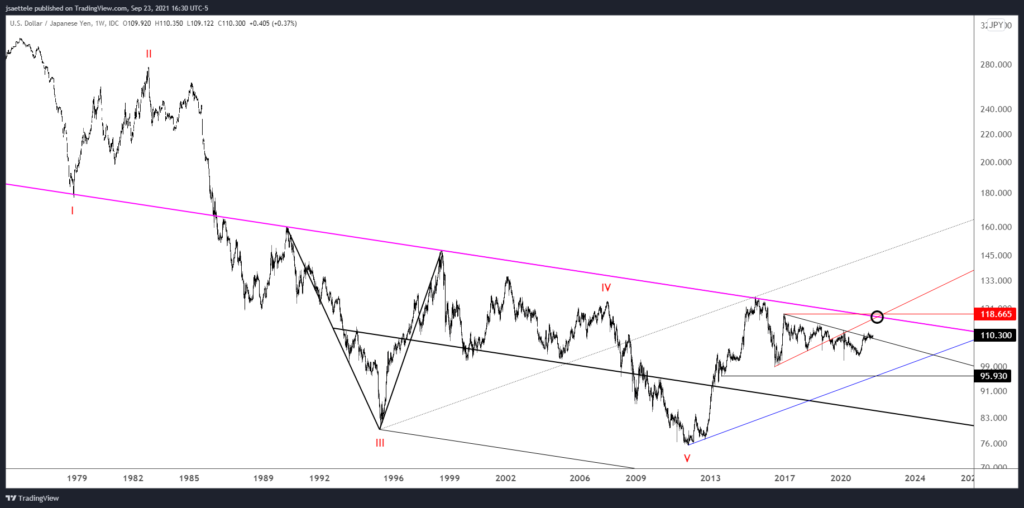
USDJPY has broken out. If the breakout is ‘for real’, then 110.00 should provide support. A measured objective for the triangle is the 161.8% expansion of the widest part of the triangle, which is wave B. That calculation yields 114.21. However, the extreme coil in USDJPY suggests that a more aggressive target is appropriate…I’m thinking a 118 handle (see below).
9/22 – Is USDJPY about to explode higher from a 6 month triangle? Watch for support near 109.37. Within the range, 111.00 is still possible resistance but that’s missing the bigger picture. USDJPY is the most ‘coiled’ since August 2014…right before price went on a 2000 pip run in 4 months. This observation is based on weekly Bollinger Band width (see below). Don’t forget that price is trading above multiyear trendline resistance as well. I’m on breakout alert.
USDJPY WEEKLY