Market Update 9/27 – USDJPY into a Key Level
USDJPY DAILY
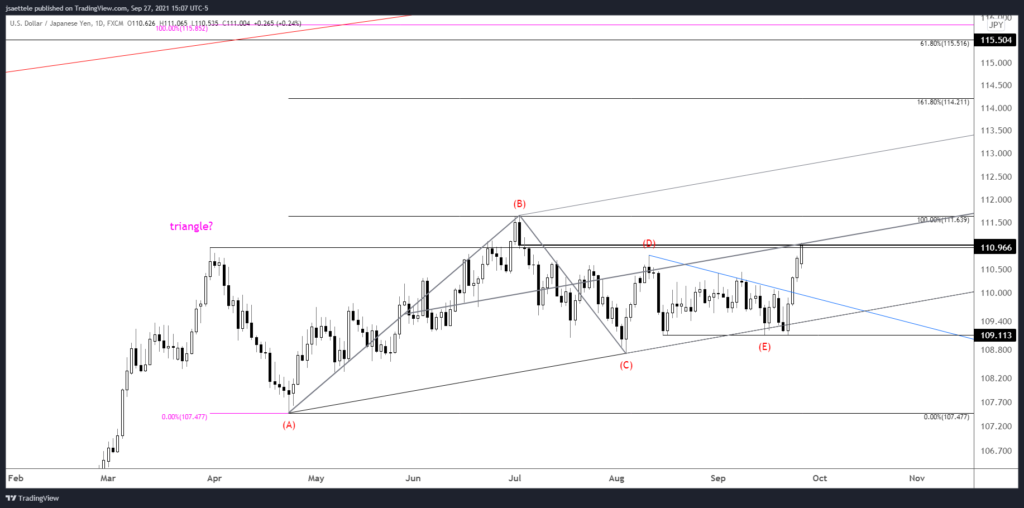
I’m bigger picture bullish USDJPY but this is a good spot for a slight pullback. Price is testing 111.00, which is daily reversal resistance and the March high. This is also the center line from the channel that originates at the April low. Proposed support is 110.40s and then 109.90s.
9/23 – USDJPY has broken out. If the breakout is ‘for real’, then 110.00 should provide support. A measured objective for the triangle is the 161.8% expansion of the widest part of the triangle, which is wave B. That calculation yields 114.21. However, the extreme coil in USDJPY suggests that a more aggressive target is appropriate…I’m thinking a 118 handle (see below).
GBPUSD HOURLY
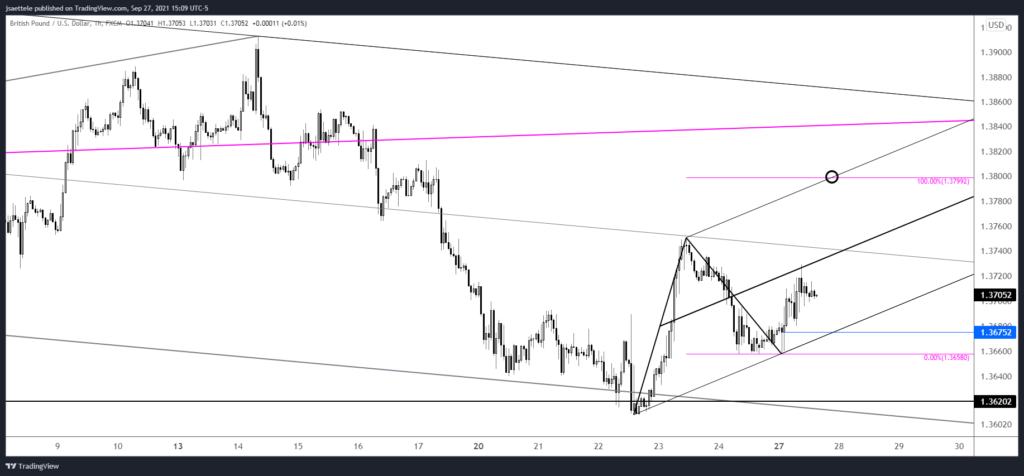
A 3 wave corrective rally may be underway in GBPUSD. If that interpretation is correct then proposed resistance is where the rally would compose 2 equal legs at 1.3799. Daily reversal resistance is 1.3807. Bottom line, watch for 1.3800 or so resistance. Proposed short term support is 1.3675.
9/23 – As suspected, GBPUSD bounced from near 1.3628. Price has already reached 1.3750. While this is proposed resistance, confidence in immediate downside is low given the ‘thinking’ that USD support is slightly lower against other European currencies. Also, a 2 day volume reversal triggered today (see below). I”m content to observe until the picture clears up.
USDCAD 4 HOUR
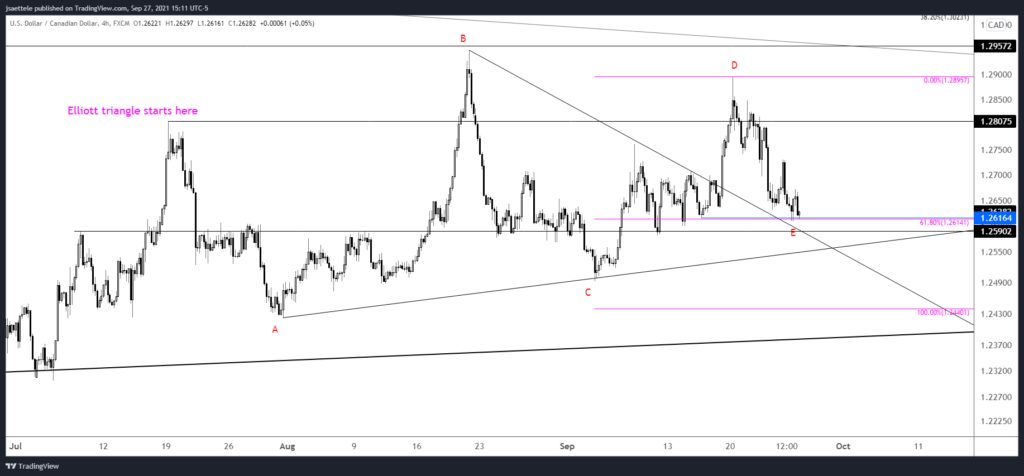
USDCAD continues to follow the triangle script. If that interpretation is correct then USDCAD should turn up soon (keep 1.2590 in mind too for support) and eventually break out to the upside. I’ll discuss alternate interpretations if price action requires as much.
9/23 – If the USDCAD triangle interpretation is correct then 1.2616 or so should provide support. This is where proposed wave E would equal 61.8% of proposed wave C (common relationship between alternating legs in a triangle), the 9/16 low, and the top side of the line that crosses recent highs.
USDTRY 2 DAY
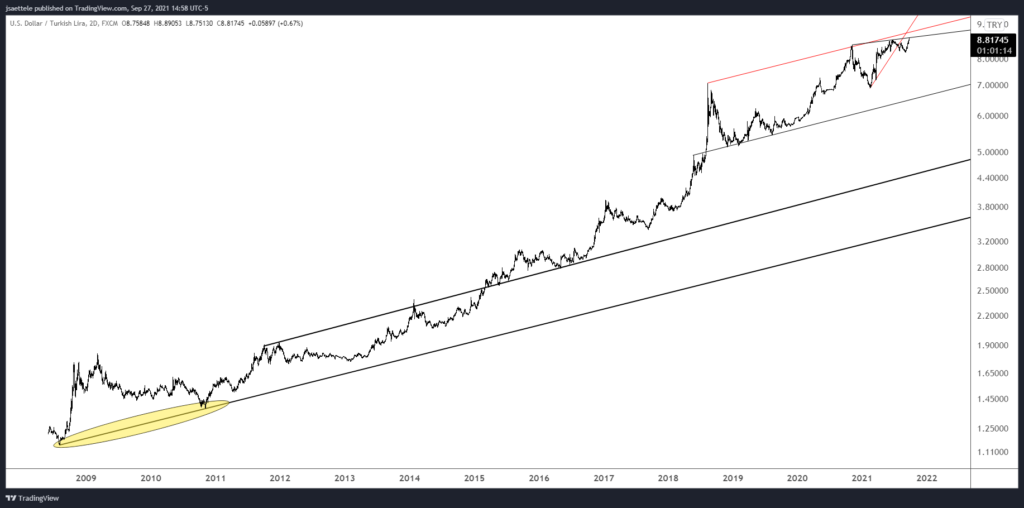
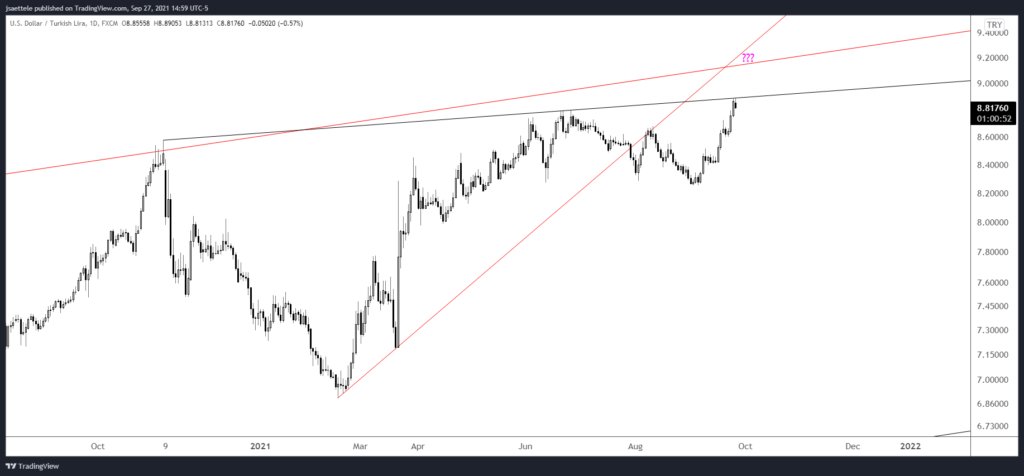
USDTRY reversed lower today from an all-time high. The reversal is interesting because the high was on the line that connects the prior 2 highs. The long term parallel in red is about 9.14. If the decline from today’s high unfolds in an impulsive manner, then I’ll plot a short entry. A close up view is below.
USDTRY DAILY
EURJPY 4 HOUR
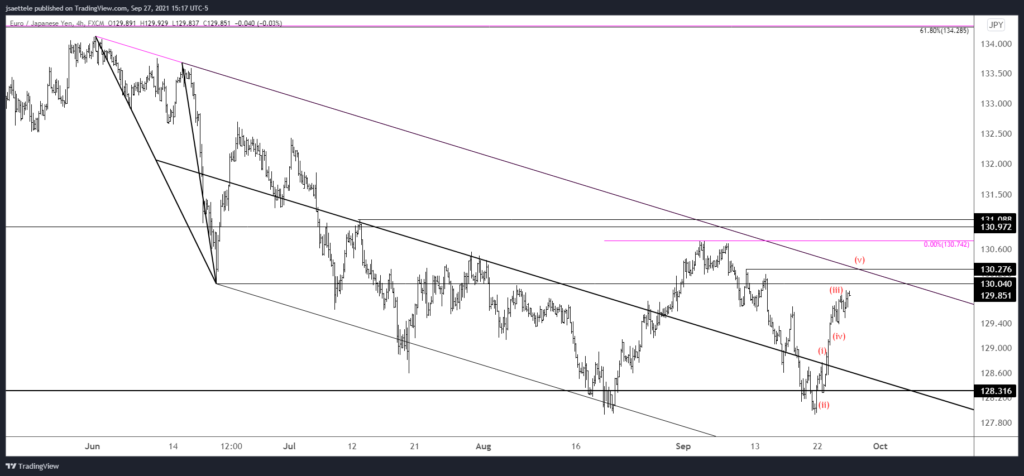
The EURJPY rally from last week’s low is in 5 waves. Strength may extend into 130.00/30 but expect a pullback with initial support near 129.40.
AUDJPY 4 HOUR
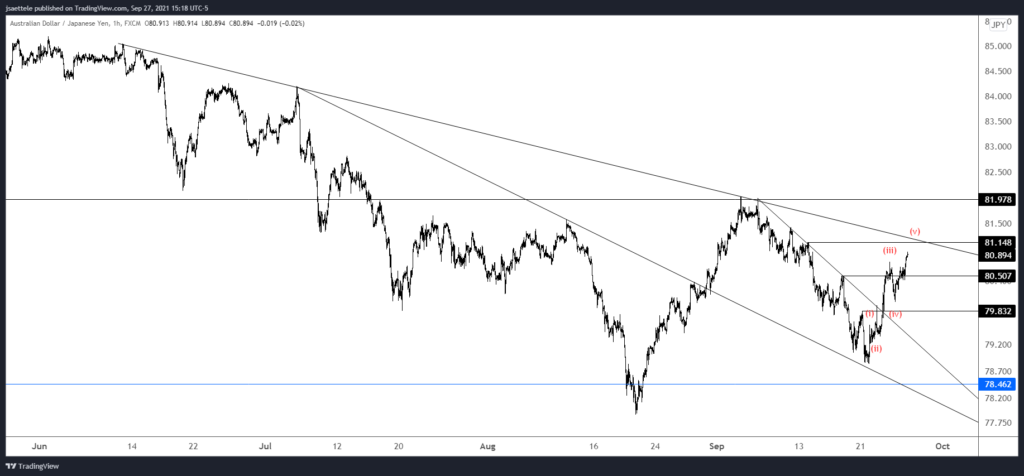
The AUDJPY rally is also unfolding in an impulsive manner. Ideal resistance is slightly higher near 81.15. As is the case with EURJPY (and Yen FX in general it seems), I’m ‘thinking’ pullback and will keep an eye on the near term pattern for the next buying opportunity.


