Market Update 9/28 – USDCAD and GBPUSD Setups
USDJPY DAILY
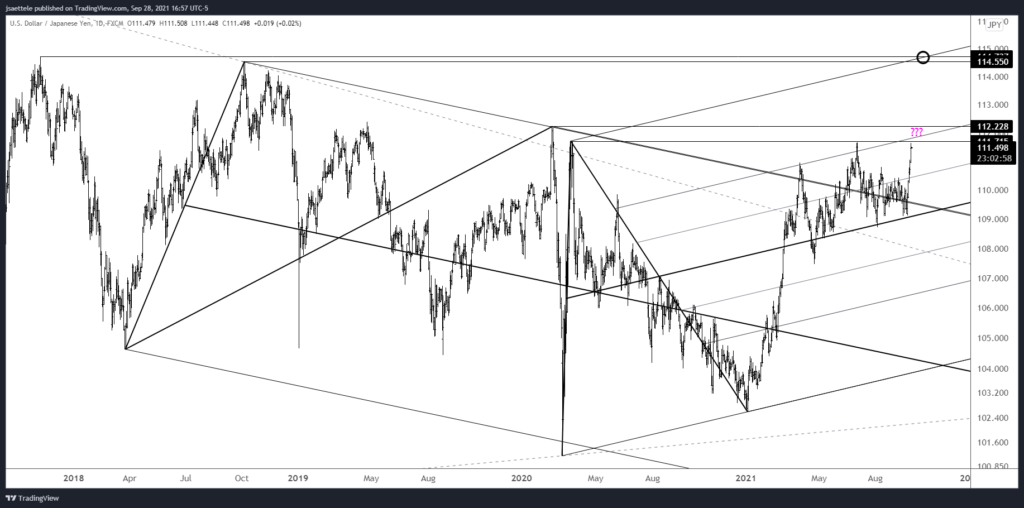
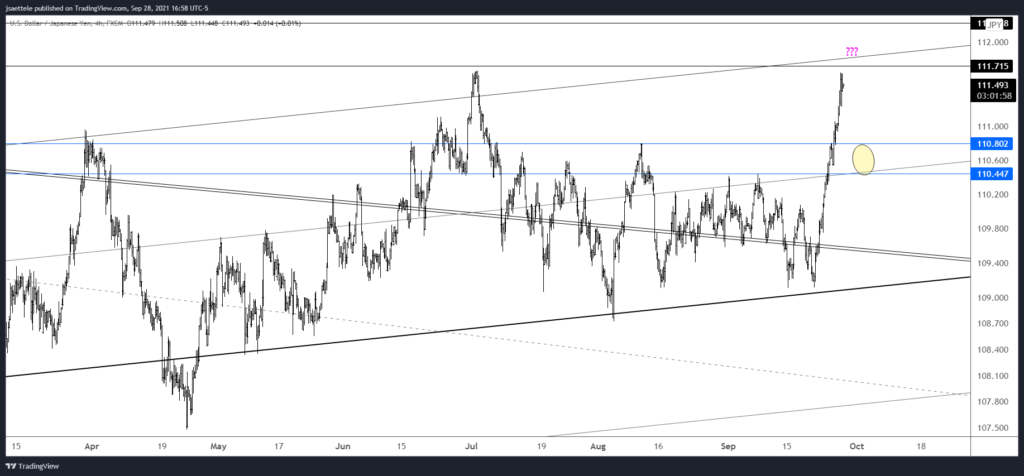
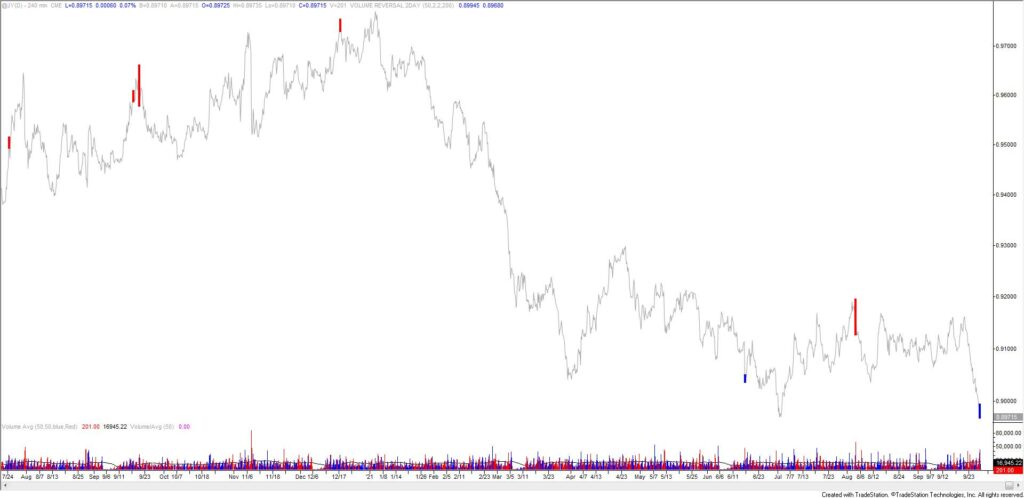
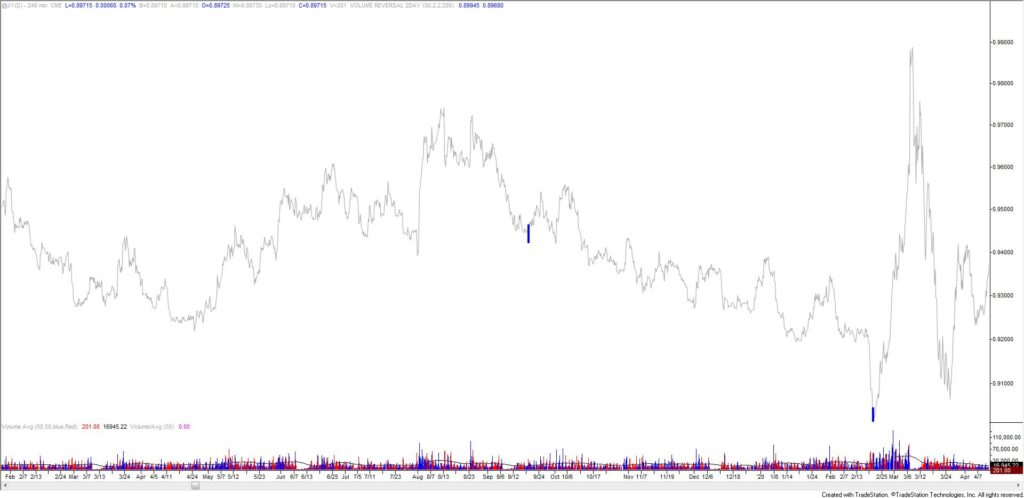
So much for the pullback. That said, I hate chasing USDJPY up here (despite being a bull)! The 75 line of the channel from the 2020 low is just above the market. This was resistance in March and July and I’m watching for resistance again. If price does start to pull back, then watch for support between 110.45 and 110.80 (see below). Also, there was a 4 hour volume reversal today. The futures chart below show all the reversals with equivalent volume for the last 3 years (remember that these are charts of JPY/USD so the chart is inverted).
9/27 – I’m bigger picture bullish USDJPY but this is a good spot for a slight pullback. Price is testing 111.00, which is daily reversal resistance and the March high. This is also the center line from the channel that originates at the April low. Proposed support is 110.40s and then 109.90s.
USDJPY 4 HOUR
JAPANESE YEN FUTURES 4 HOUR
JAPANESE YEN FUTURES 4 HOUR (2019-2020)
USDCAD DAILY
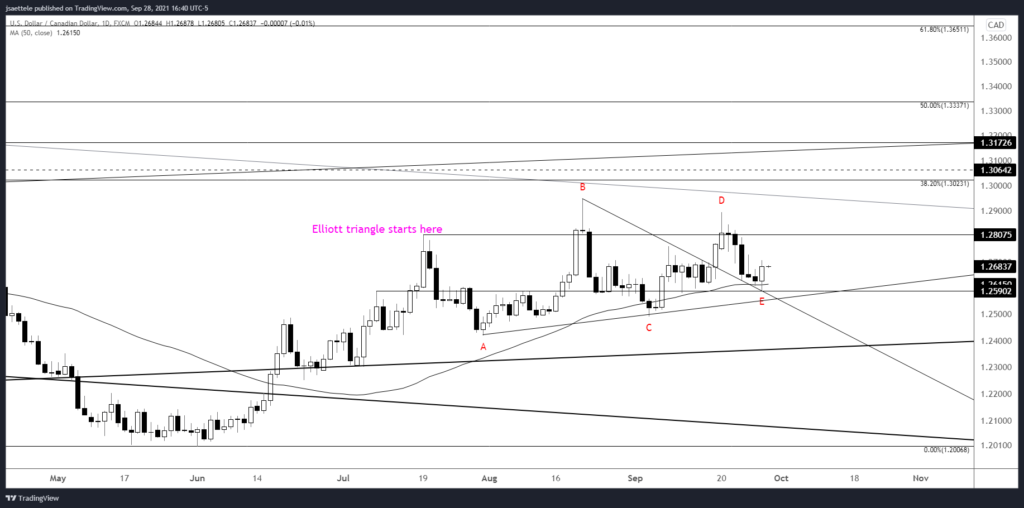
My view is that USDCAD completed the triangle today. The implication is that price heads higher and eventually breaks above the August high. 1.2800ish is still possible resistance within the range. Bottom line, I’m bullish.
9/27 – USDCAD continues to follow the triangle script. If that interpretation is correct then USDCAD should turn up soon (keep 1.2590 in mind too for support) and eventually break out to the upside. I’ll discuss alternate interpretations if price action requires as much.
GBPUSD 4 HOUR
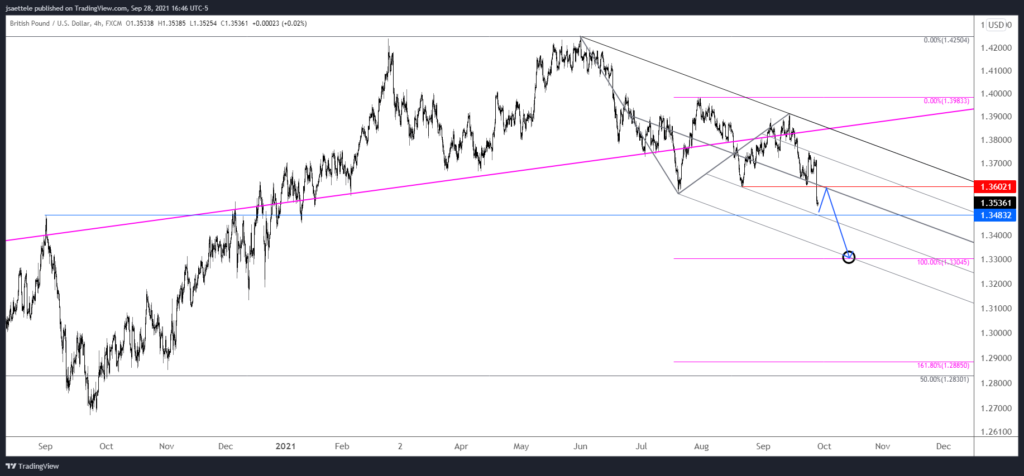
Playing for a countertrend move was the incorrect move. Oh well, move on. GBPUSD could bounce near 1.3483 (Sep 2020 high) but the setup is to short into the underside of the center line from the channel. That line is reinforced by former support at 1.3602. A soft target is where the decline from June would consist of 2 equal legs at 1.3305.


