Market Update – May 20
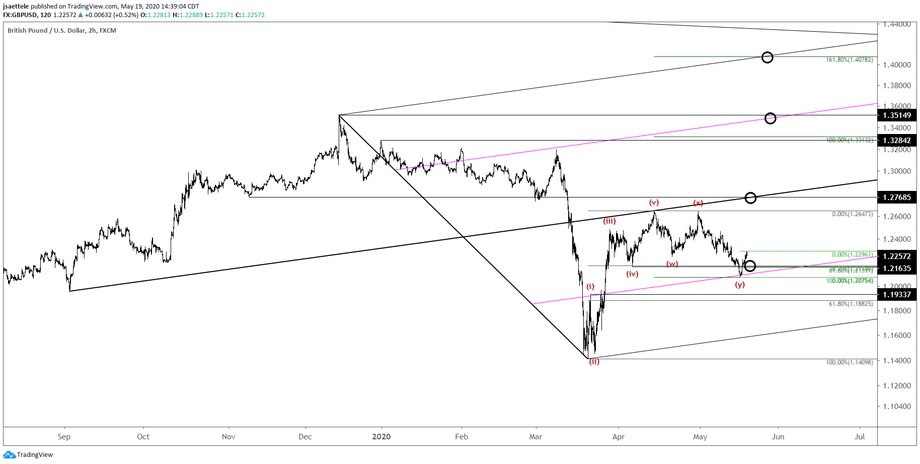
Resistance came in slightly higher than thought for GBPUSD but the idea remains the same. Proposed support for long entry is 1.2160/90s. The bottom of the zone is the 61.8% retrace of this week’s rally and 4/6 low. The top of the zone is VWAP from this week’s low (see hourly futures chart 2 charts down). Additional bullish evidence includes a daily volume reversal yesterday (see daily futures chart below). The last daily volume reversal was in January 2017, which was an important low. Also, don’t forget seasonal tendencies are now bullish. Elliott structure suggests that the rally from this week’s low is either a C wave or 3rd wave, so upside potential is significant.
5/18 – GBPUSD has turned up sharply so I must consider the possibility that the corrective decline from the April high is complete. Specifically, the decline is counted as W-X-Y decline because the subwaves are corrective. Near term, watch for resistance near 1.2280. If price trades to there and pulls back, then the center line will be watched for support near 1.2170.
BRITISH POUND FUTURES DAILY

BRITISH POUND FUTURES HOURLY

GBPUSD WEEKLY SEASONALITY

EURO FUTURES HOURLY

I am moving the long entry slightly lower to 1.0860 to align with VWAPS from recent price extremes (circled) and the 61.8% retrace of the rally from last week’s low. If EURUSD is a bull, then there is no better spot to find the next low than a VWAP and Fibonacci confluence.
5/18 – Be nimble…no ego…don’t be afraid to change your mind. Recent FX action, especially in EURUSD, drives home the importance of these trading ‘truths’. Action since the March low is still contracting but could be a consolidation bottom rather than a bearish triangle. Both interpretations are valid. 1.0955 (also the month open) is still possible triangle resistance but there is a short term ‘slingshot’ buy setup (buy into the blue line) into 1.0875, which is also former resistance. There is also a confirmed bullish channel from the March low because the median line was tagged and the lower parallel has held as support.
AUDUSD HOURLY

AUDUSD took out the April high and reversed today. The rallies in both AUDUSD and NZDUSD from last week’s lows are impulsive so those lows may be ‘higher lows’ within a larger bullish cycle. However, we have another non-confirmation today with AUDUSD making a new high and NZDUSD failing to do so. We’re left with conflicting evidence. In any case, today’s failure just above the April high and at a short term channel presents a short term range trade. I am looking towards .6470s in the near term.
USDCAD HOURLY

A sharp downside break from the 1 month+ triangle would target 1.3550-1.3600. If we’re going to get a break sooner rather than later then 1.3970-1.4010 should provide resistance. Analysis of CAD futures (see below) reinforces a bullish CAD (bearish USDCAD) view and the proposed target. VWAP from the March CAD low held as support at the most recent low (USDCAD high) and 2020 VWAP is the equivalent of 1.3600 in USDCAD!
5/18 – USDCAD traded into proposed support at 1.3950 today but is weak as a kitten and attempting to break. If price does break here then immediate focus would be on the median line of the Schiff fork near the 1.3855 lows. If reached, then trading focus would be on shorting a bounce into the underside of the blue line, which has been support throughout May. That would be about 1.3960/70.
CANADIAN DOLLAR FUTURES DAILY

USDJPY 4 HOUR

If USDJPY follows through on the head and shoulders bottom, then the target is 109.38. This is the origin of the wedge (wedge breaks often return to their origin) and just under the 61.8% retrace (not shown) of the decline from 3/24. Watch for support near 107.50 (4/30 high, 25 line of short term bullish fork, and 200 ma on 4 hour chart).
5/14 – USDJPY held up today so I’m looking higher as long as price is above Thursday’s low at 106.74. There is a high volume level at 107.03 that is proposed support for entry. Also, action since the 4/29 low is a possible head and shoulders. I like that combination…a head and shoulders following a wedge break.


