Market Update – August 18
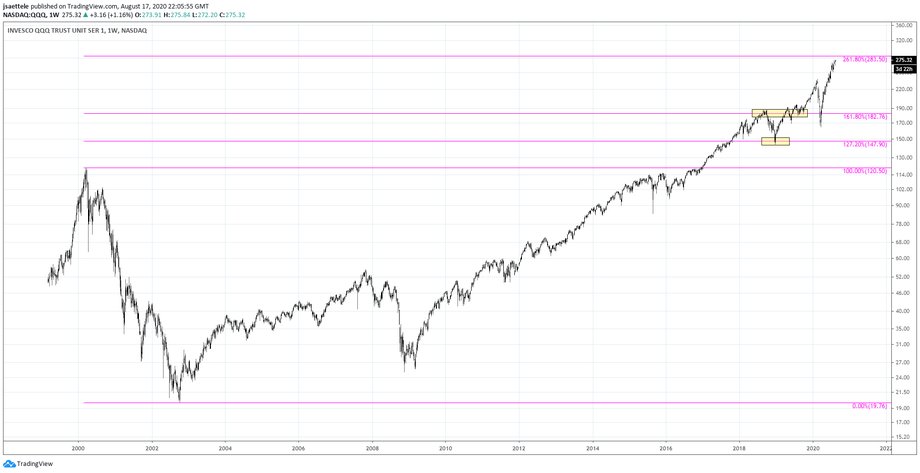
QQQ WEEKLY
Be aware of the 261.8% expansion of the 2000-2002 decline in QQQ at 283.50 as potential resistance. That’s about 3% higher. The first 2 Fibonacci levels, 127.2% and 161.8%, presented several opportunities (close up view is below). The equivalent level in the Nasdaq Composite Index is 11643.40, which is 4.6% higher than today’s close (2 charts down).
QQQ WEEKLY

NASDAQ COMPOSITE WEEKLY

EURUSD HOURLY

EURUSD has traded sideways since 7/31 in what could be a 4th wave triangle. If it is, then the ‘textbook’ move is for one more drop into 1.1750 or so before EURUSD turns up and completes a ‘terminal thrust’. Measured levels are 1.2053 and 1.2137. Given sentiment, a consolidation top is certainly possible. Bottom line, pay attention to 1.1750. I favor either going with weakness below 1.1696 or fading the next leg up into one of the noted levels.
8/16 – EURUSD finished higher last week for the 8th consecutive week. That has happened twice since inception of the euro; January (9 up weeks) and December 2004. Both instances occurred near important highs. Again, add this to the list of things that tend to occur near important turns.
GBPUSD HOURLY

Near term, GBPUSD is in the same position as EURUSD. A triangle appears underway from the 7/31 high. 1.3030 is proposed support for triangle wave D. Measured objectives are 1.3312 and 1.3390. The latter level is in line with the March 2019 high.
7/29 – Cable has reached the median line from the structure off of the September low. This is the 3rd test so be aware of potential for median line acceleration. In that event, the next level of interest is 1.3200. I’d love a pullback to 1.2700 (see daily chart below). We may get it because price has reached VWAP from the 2018 high (see 2 charts down). For those that think longer term anchored VWAPs aren’t valuable, check out the VWAP line from the 2014 high on the same chart.
USDJPY 4 HOUR

USDJPY is nearing proposed support at 105.85. The month open is 105.80 as well. If the massive 7/31 reversal put in a more important USDJPY low then 105.80s likely holds.
8/16 – USDJPY turned down on Friday from the 25 line within the channel from the March high. This line was resistance in June and July. I’m thinking that support resides near the median line and daily reversal support (7/31 close) at 105.85. The next upside level of interest is the upper parallel and 200 day average at 108.10. I favor buying weakness near noted support.
GBPJPY 4 HOUR

This GBPJPY fork is a thing of beauty. The 25 line has been precise resistance and support and the median line has been precise resistance. Pay attention to the 25 line near 138.50 for support. I love this idea given the reward/risk profile (next big upside is 145-146). If 138.50 can hold, then upside acceleration is in play on the next median line test (will be the 3rd test).
8/3 – I still like GBPJPY upside. Ideal support is the lower blue parallel that crosses pivots since May and was recently resistance (hourly chart below shows more detail). This line is in line with the 200 day average at 137.50. Upside focus is 145.00ish, which is channel resistance from February 2018, the upper parallel from the bullish fork, and the February high.


