Market Update 4/14 – Stalking for a Rates Reversal
TLT WEEKLY
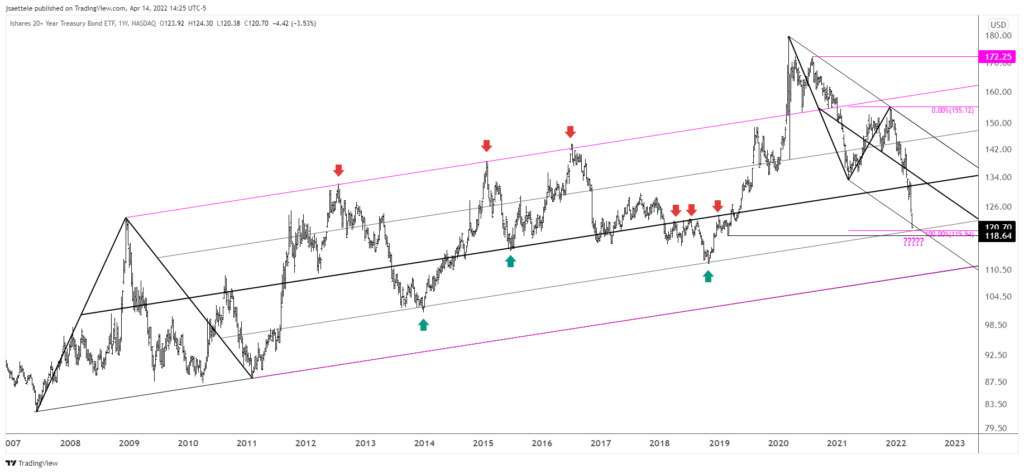
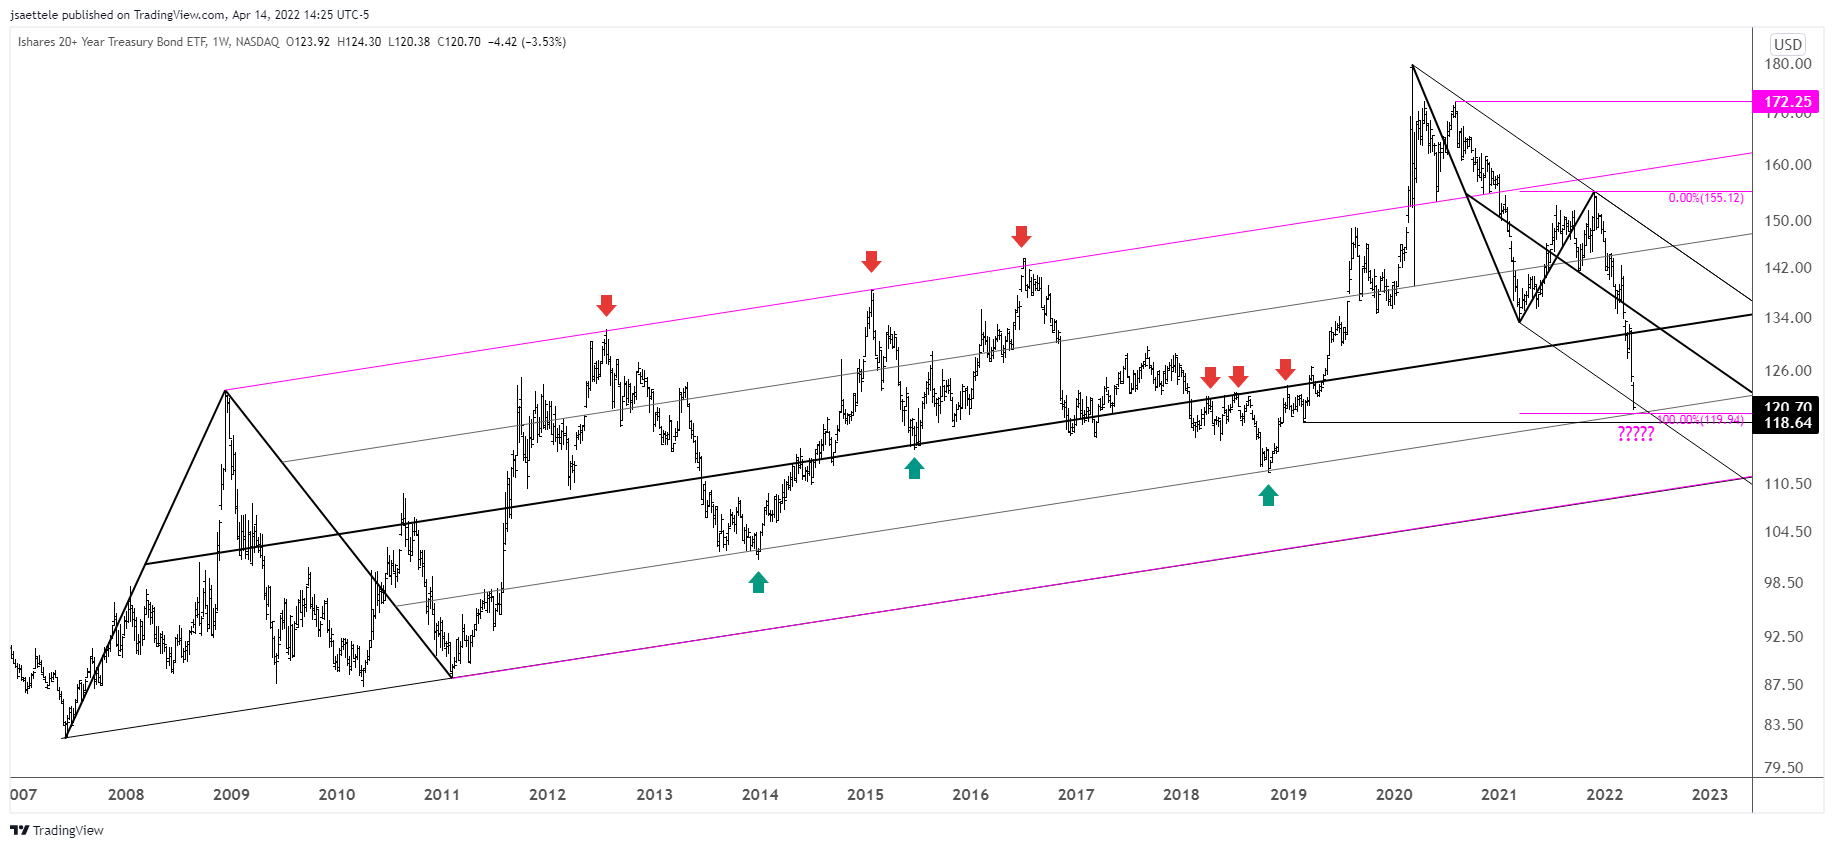
It’s clear that the USD won’t roll over until/unless rates stop going up. TLT is the long bond ETF, which moves inversely to rates. So, a turn higher in TLT means a turn lower in rates. This could happen soon because TLT is closing in on a massive level defined by 2 legs down from the August 2020 high (using this high rather than the COVID spike high…the August high is the daily and weekly closing high) at 119.94. It’s also the 25 line within the channel from the 2007 low. This line nailed the 2013 and 2018 lows. Finally, the decline channels. If we do get a reversal then there should be a USDJPY play.
U.S. 30 YEAR YIELD WEEKLY
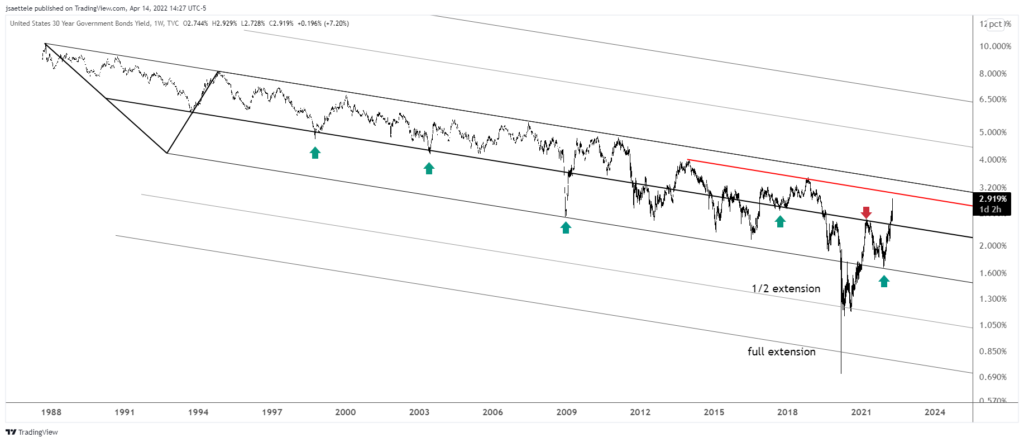
For the 30 year yield, be aware of the red parallel on this chart at about 3.05%. The parallel is based on the long term channel. I’ve only brought this chart up at major turning points in yields (bonds). I think we’re very close to one of those turning points now.
EURUSD DAILY
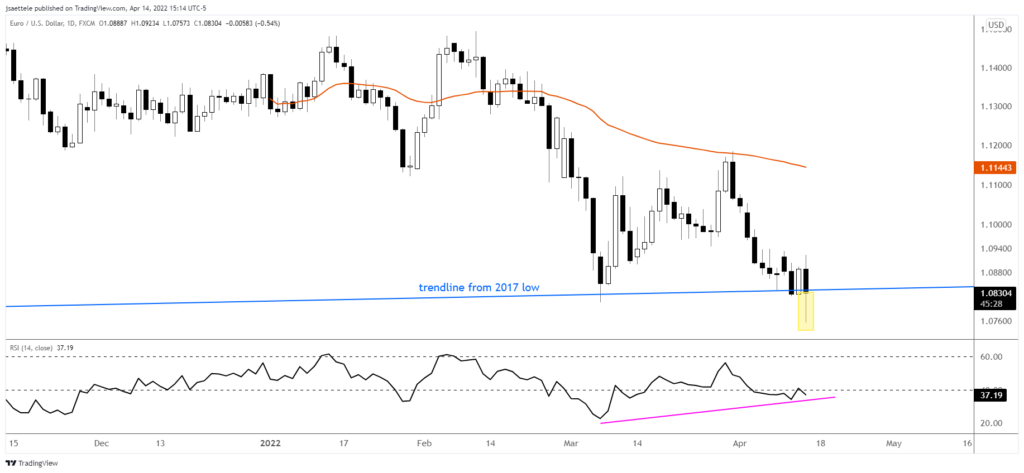
I was confident that yesterday marked ‘the low’ in EURUSD. In this business, be prepared to get egg on your face because Mr. Market will prove you wrong time and time again. There is nothing to do but move on! Fast forward one more day and I’m not ready to give up on the possibility of a low. In fact, price closed right at the trendline from 2017 (again) and left a long lower wick. There is also RSI divergence with the March and April lows. In summary, there is evidence to at least entertain the idea of a low. Tomorrow is Good Friday so we’ll probably have to wait until next week for resolution.
Do you make a profit trading EUR/USD?
Try our funded trader program and get up to $1,000,000 in funding.
Learn more
AUDUSD DAILY
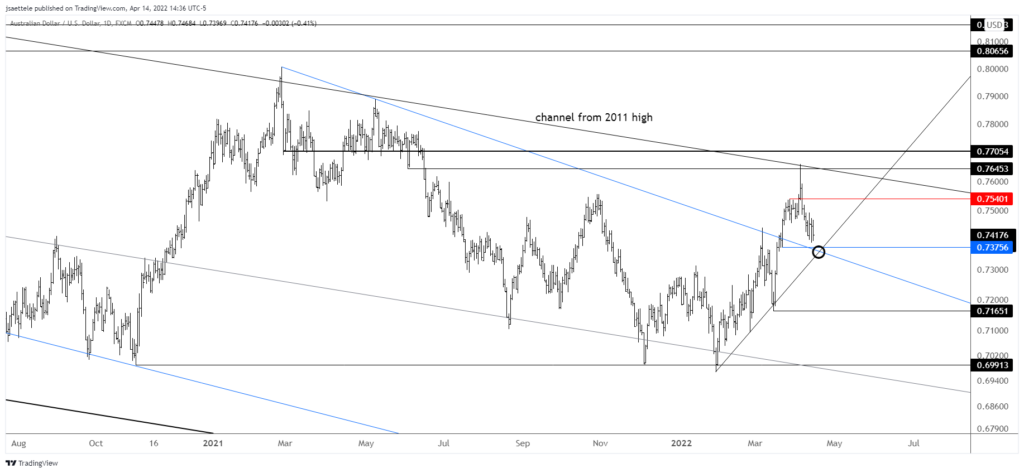
Nothing to add regarding AUDUSD. The confluence of former trendline resistance (blue line) and the upward sloping support line intersect at about .7360 now. All eyes are on that level for support and a low.
4/12 – Aussie put in a bullish outside day today, which is kind of annoying because price didn’t yet reach proposed support near .7375. In any case, continue to pay attention to that level for support but also be aware of .7540/60 for resistance.
USDMXN DAILY
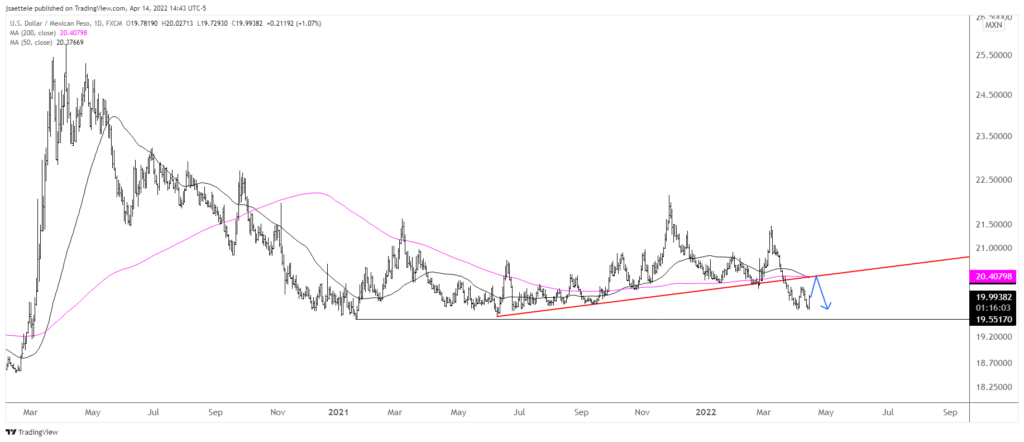
USDMXN reversed sharply higher today in what could be the start of a move into 20.40 resistance. That level includes the 50 and 200 day averages along with the underside of former trendline support.

