Market Update 1/4 – Stalking USDJPY
ETHUSD DAILY

ETHUSD is in a potentially dangerous spot. Price is pressing against 3900, a level has been support (give or take) since October. This is also the 20 day average. The most important technical aspect of this chart is the line that extends off of the May and September highs (magenta line). This line has been support since the 12/4 crash. If it gives way, then look out below. My long term wave count suggests downside towards 1000 or so (see below).
ETHUSD DAILY

USDOLLAR DAILY

USDOLLAR has churned sideways since late November. Does today’s action hint that the resolution to the chop will be lower? My reason for this thought is that today’s high is at daily reversal resistance (12/15 high) and the underside of the channel from the 2021 low. This line was support on 11/30 and 12/16. Also, don’t forget that the December high is at the 50% retrace of the decline from March 2020. A break below 12155 would suggest that the move is lower.
USDJPY DAILY

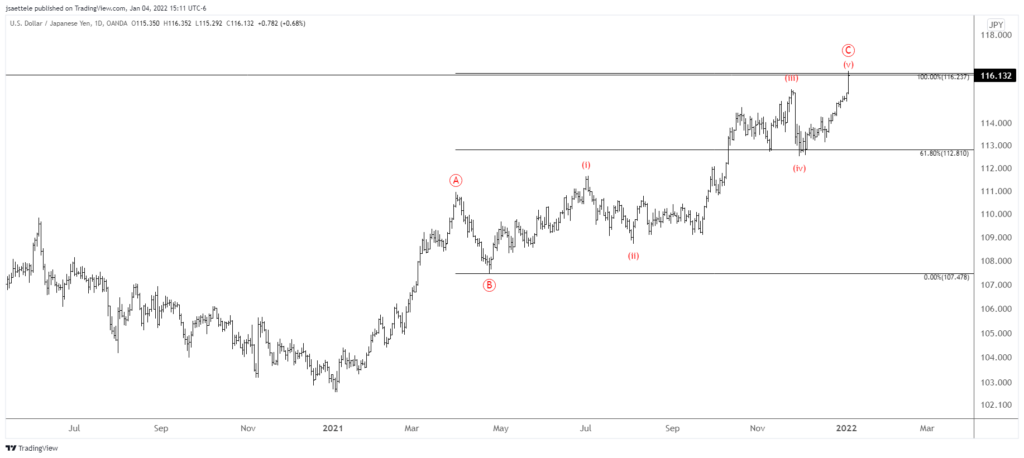
Well, the re-test is out of the question but this USDJPY move could be a false breakout. The chart above shows square root levels. Square the year opening price and add/subtract that number in increments. For USDJPY, the square root of 11510 is 107 so the first square root up is 116.17. The idea is to look for a turn at the first square root level during the first week of the year in a market that is already extended. Several examples are below. An Elliott case is also made for a top as the rally from January 2021 consists of 2 equal legs (log scale). This chart is below. An objective trigger isn’t present yet.
12/27 – I’m wondering if USDJPY is going for a re-test and failure of the November high. Remember, the 61.8% retrace of the decline from 2015 is 115.52. Also, the rally from March 2020 channels perfectly.
USDJPY DAILY

USDJPY DAILY 2017

EURUSD DAILY 2021

EURUSD DAILY 2019

AUDUSD 4 HOUR

Given the proximity of the AUDUSD channel to the recent low, it’s worth a shot on the long side. The next upside level of interest is the top of the channel near .7350/70.
1/3 – AUDUSD has pulled back from just shy of the noted .7290. I want to see support at/near .7160/70 in order to maintain a constructive view. Failure to do so would leave me neutral at best.
NZDUSD 4 HOUR

Kiwi is lagging AUDUSD since the low, which is why I think Aussie is the better trade but the flat correction discussed yesterday may be complete in NZDUSD. A possible inverse head and shoulders is also evident. The pattern completes above the neckline near .6860. That’s the trigger.
1/3 – NZDUSD levels are playing out perfectly. Price has pulled back from .6860 (high was .6857) and focus for support remains .6735/55. An Elliott interpretation is shown in which the rally is an impulse followed by an expanded flat.


