Market Update – June 25
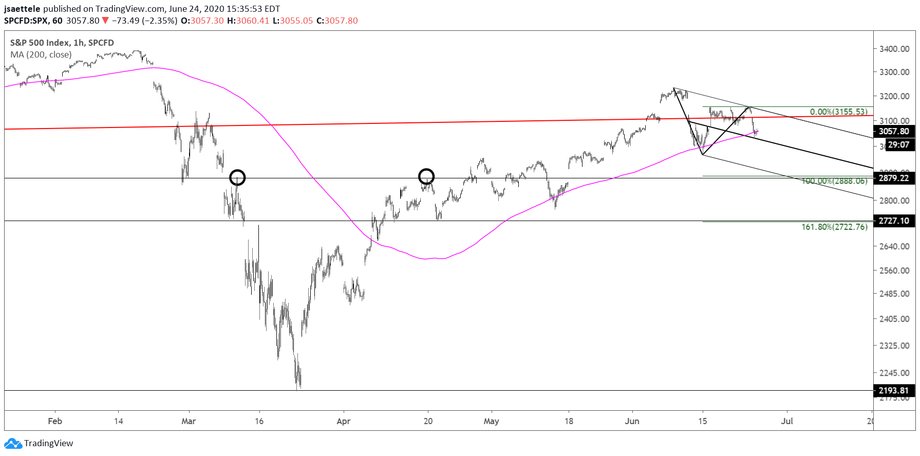
SPX HOURLY
SPX initial downside focus is 2888, which is 2 legs down from the June high and a well-defined horizontal level. Notice how price churned around the red line on this chart for most of June before turning sharply lower today. That line extends off of the 2018 highs. It’s served as precise support and resistance over the last 2+ years. The daily is shown below and the monthly is 2 charts down. Extend the line back in time and you’ll see that the line crosses the 2000 high (exactly). It’s safe to say that this line is an ‘angle of influence’.
SPX DAILY

SPX MONTHLY

USO 4 HOUR

USO barely took out the 6/5 high on Tuesday before price plunged today. My view is that a flat is unfolding from the 6/5 high. The implication is that price drops below 25.36 before finding support. Pay attention to 24.50. This is the former 4th wave low, 38.2% retrace of the prior 5 wave advance, and VWAP off of the low.
6/15 – The USO (oil ETF) pattern is clear. The drop from last week’s high is in 5 waves and is viewed as wave A of a 3 wave correction. Ideal wave B resistance is former support at 27.72. This is also the 61.8% retrace of the 5 wave drop.
DXY DAILY

DXY turned back up today so respect potential for an attempt (finally) on 98.40/60. That zone is loaded with technical consideration for resistance; the 200 day average, well-defined horizontals, 2 legs up from the June low, the upper parallel of the Schiff fork from the high, and the center line of the channel from the 2011 low. Ideally, a rally into that level ‘resets’ sentiment for the next leg lower in the USD.
6/10 – DXY is testing the 25 line of the channel from the 2011 low. This line was support at the March low. Also, the June 2019 low is 95.84. DXY closed today at 96.08 after making low at 95.72. That’s right…DXY is almost exactly flat over the last year. At risk of sounding like a broken record, ‘this is a good spot for a rally attempt’. Markets (stocks down and USD bounce) started to fade after the Fed so I’ll stick with yesterday’s ‘sell the news’ call.
AUDUSD DAILY

AUDUSD traded to .6975 on Tuesday before turning down. The area just above .7000 has been significant since late 2018. As long as price is below this month’s high, I see no reason not to look towards .6690ish. This is another clear level and is reinforced by the 200 day average and 2 legs down from the high. .6900/25 is proposed resistance (see the close up chart below).
6/22 – AUDUSD turned up sharply today, forming a bullish engulfing candle pattern in the process. Pay attention levels within the channel from the April low. The center line is proposed resistance near the 6/16 high at .6977. The high volume level from last week is possible support now at .6845.
AUDUSD DAILY

NZDUSD 8 HOUR

The June high in Kiwi is on a 2+ year trendline. Look towards the lower parallel of the channel from the March low near .6275 as long as that line is intact. Resistance should be the underside of the center line of that channel near .6560.
6/23 – Take a close look at everything since the 6/12 low in NZDUSD. Each leg is corrective. The suggestion is that a complex correction (labeled W-X-Y rather than A-B-C) has taken place. Also, high today was .6533…just 2 ticks under daily reversal resistance at .6535 (daily reversal resistance is the close of the high day, in this case that’s 6/10). Also, the 75 line within the channel from the March low was resistance today. This line has been resistance and support over the last month+. I lean towards the short side in NZDUSD towards the 25 line near .6350. Let’s get past RBNZ later before entering.
NZDUSD HOURLY


