Market Update 9/8 – Well-Defined Short Term USD Patterns
Market Update 9/7 – USD Comeback
September 8, 2021Market Update 9/9 – Turkish Lira Setup
September 10, 2021
NIKKEI 225 DAILY
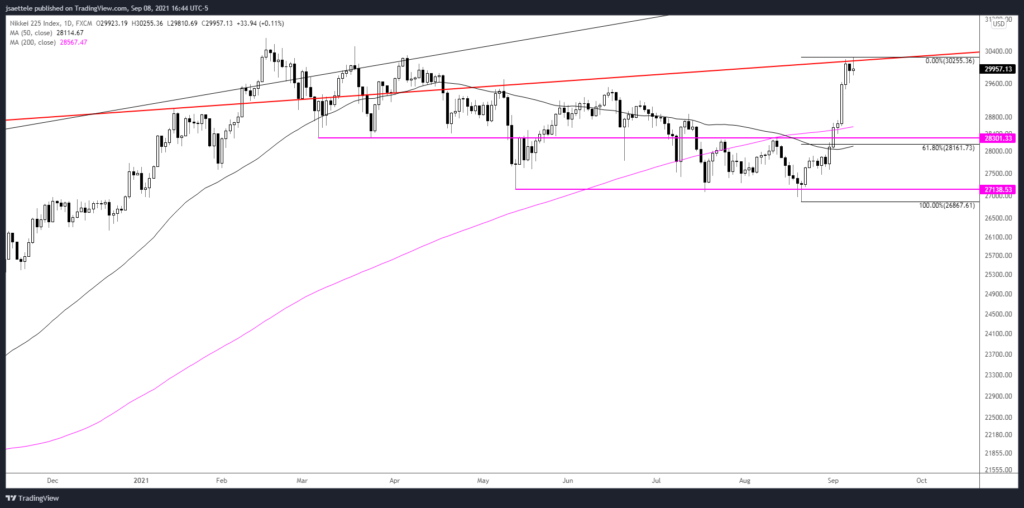
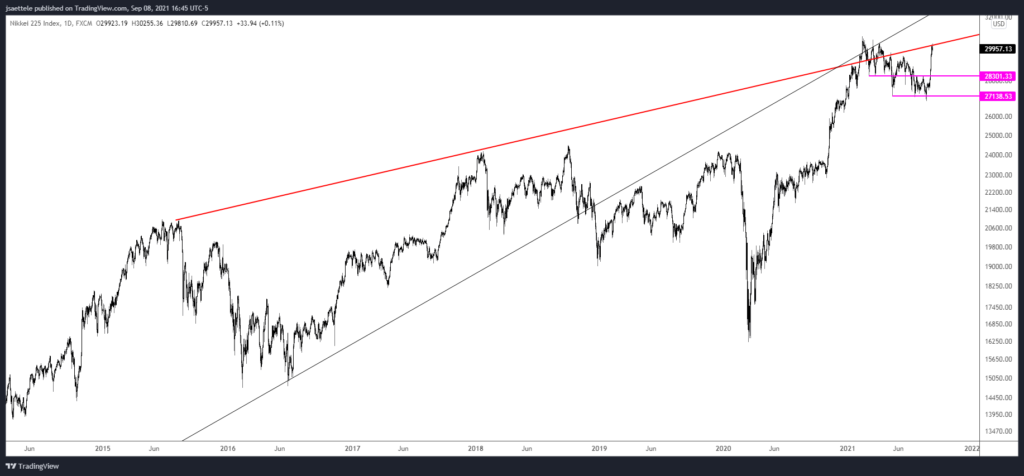
The Nikkei looks near term ‘toppy’ after action printed a long upper wick today. The high is near the April high and at a long term trendline. The long term trendline extends off of the 2015 and January 2015 highs (see below). Notice that the line was precise resistance in January and May of this year. I’m looking for a pullback from the current level. Keep 28300 or so in mind for support.
NIKKEI 225 DAILY
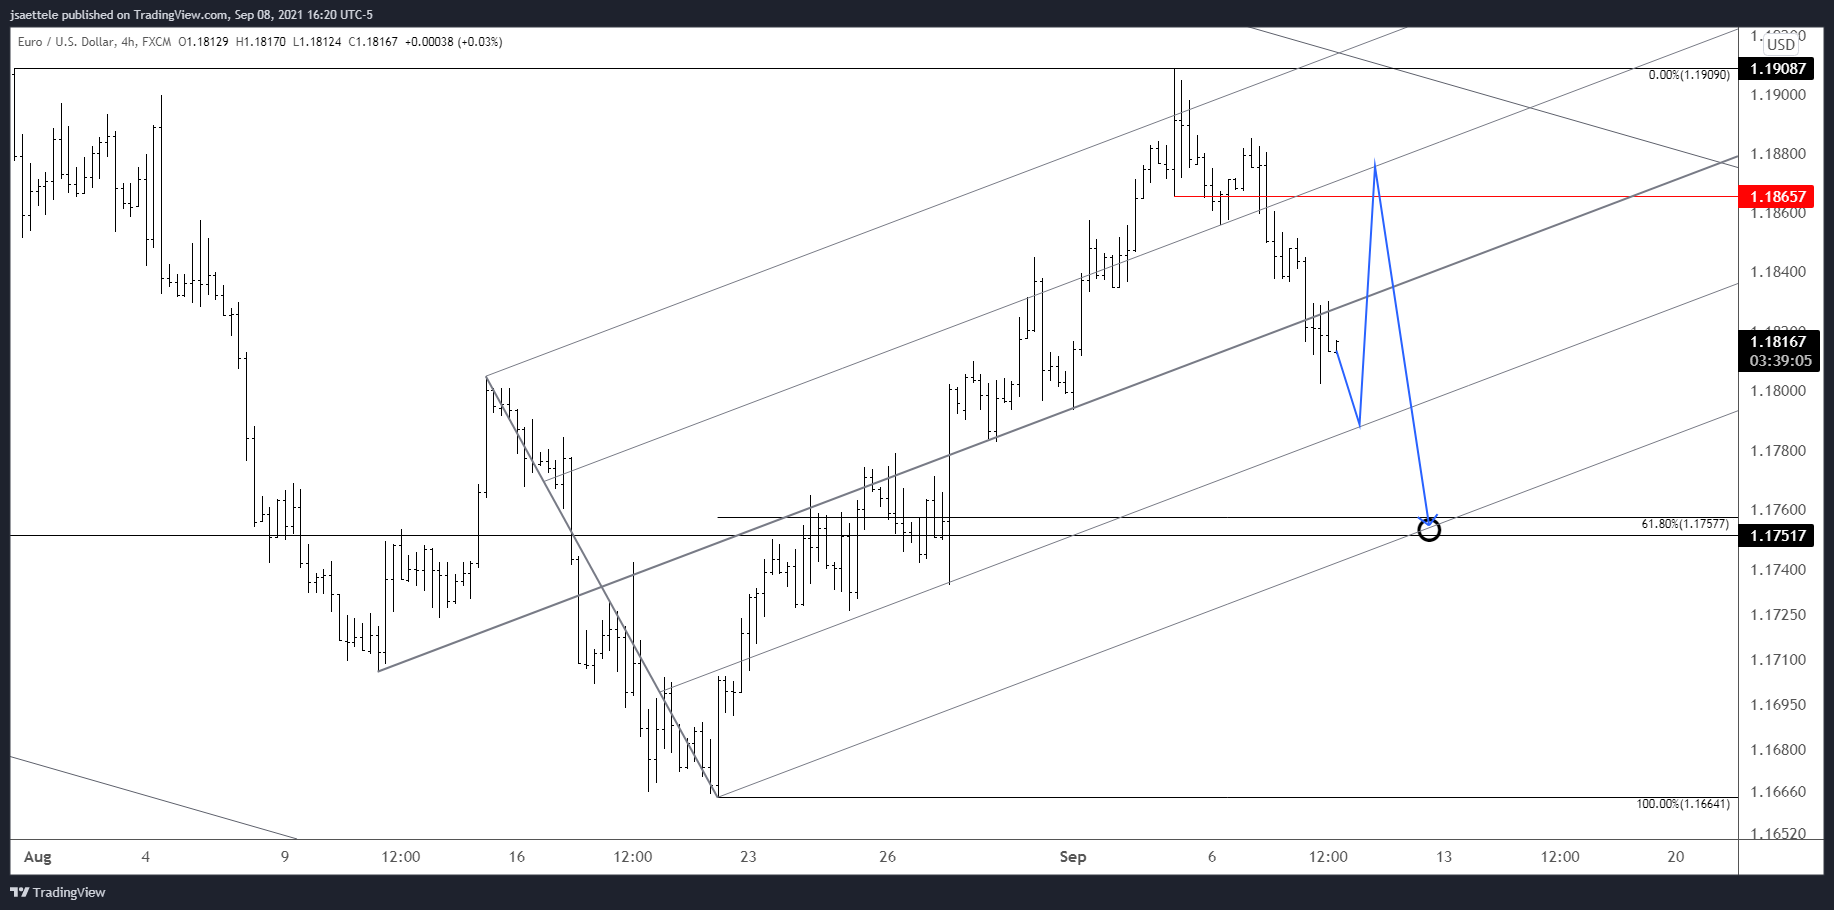
EURUSD 4 HOUR
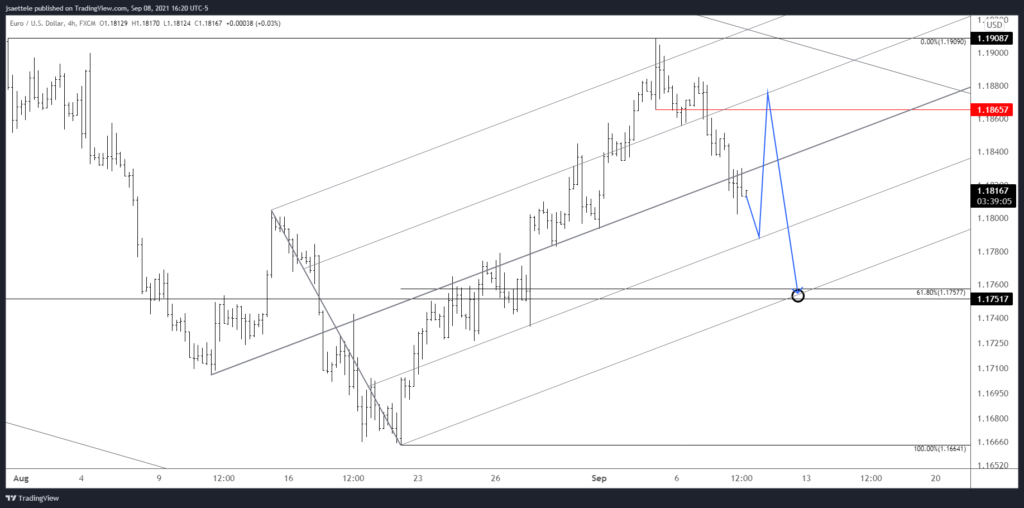
ECB is Thursday. I don’t make trading decisions based on my ‘fundamental’ analysis but I do like to know when important news events are going to be released. Not much has changed regarding the near term technical picture for EURUSD. Pay attention to parallels within the near term EURUSD bullish fork. 1.1780s and 1.1870s are proposed support and resistance. I favor shorting strength into the latter level and targeting 1.1750s (61.8% retrace).
9/7 – EURUSD poked above the 7/30 high on Friday before putting in a doji. Downside follow through today warrants a near term bearish stance. 1.1820 is a bounce level but downside focus is the lower parallel of the fork from the 8/11 low. This intersects the 61.8% retrace and July low at 1.1752/58 early next week. Proposed resistance is 1.1865.
GBPUSD HOURLY
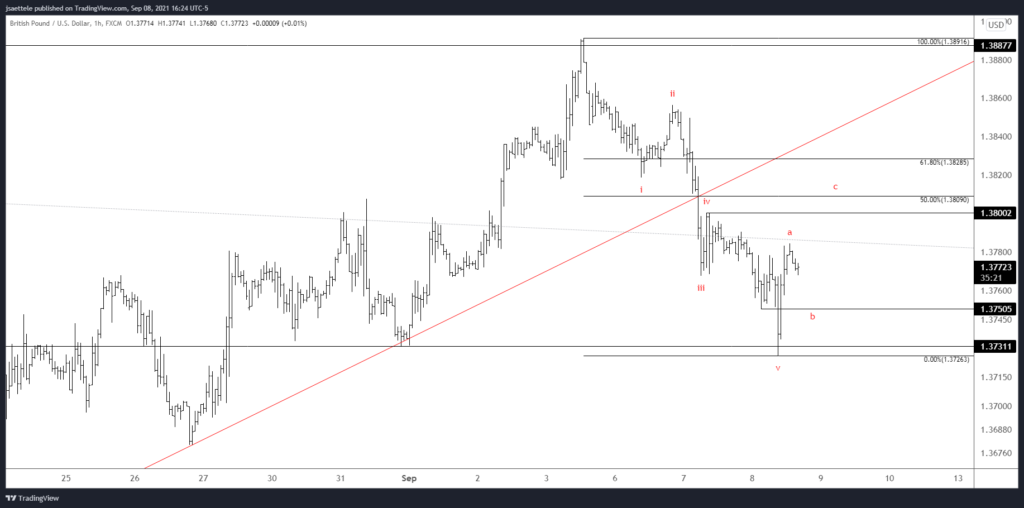
The GBPUSD drop from last week’s high is in a clear 5 waves. Today’s rally off of the low is probably the bulk of wave A within a 3 wave (A-B-C) corrective advance. This means that I’m looking for a slight pullback (1.3750 support) and another push higher (1.3800/30 resistance) before additional weakness.
NZDUSD HOURLY
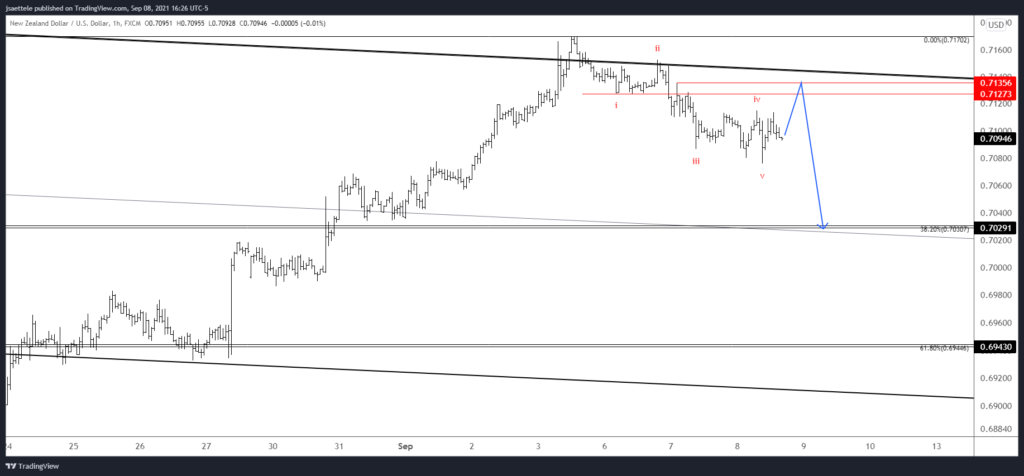
The Kiwi drop also appears impulsive (5 waves). The implication is the same as it is for GBPUSD. That is, I’m thinking that a corrective (3 wave) bounce is underway from today’s low. .7127/36 is ideal resistance. Near term downside focus remains .7030 or so.
9/7 – NZDUSD continues to follow the script. Generally speaking, .7100/25 has been a pivot for most of the year and the failure to hold above this zone on the latest rally is bearish. The current pattern is unclear but initial downside focus remains the top side of the 25 line near .7030 (also the 38.2% retrace)
USDCAD 4 HOUR
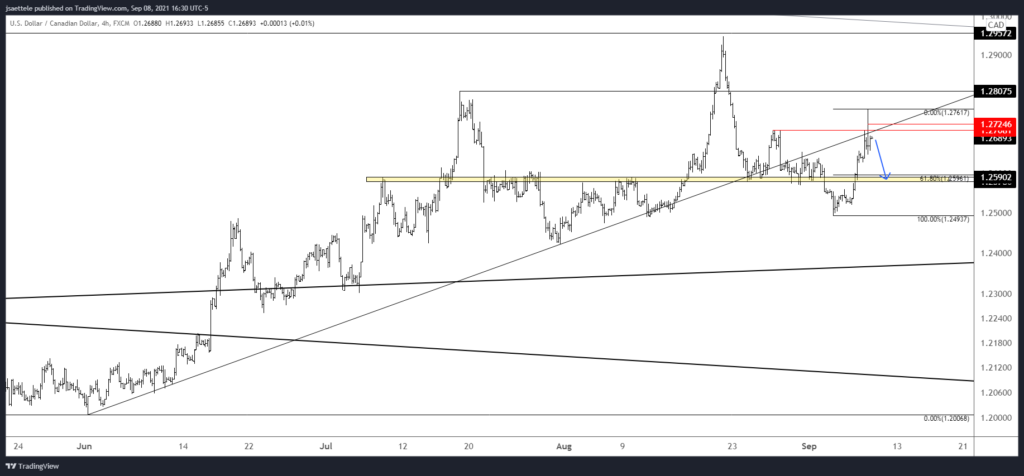
The bigger picture for USDCAD isn’t clear but today’s post BoC spike looks like a classic ‘sell the news’ trade. Resistance is well-defined at 1.2708/20s (8/27 high and year open) and 1.2580/90 remains well-defined for support. In fact, the 61.8% retrace of the rally from 9/3 is 1.2596.
9/7 – USDCAD has turned up from the confluence of the 50 and 200 day averages. CAD futures also turned down from 2021 VWAP (see below). In other words, there is a good deal of USDCAD support (CAD resistance) at the recent pivot. As such, I’m looking higher towards 1.2800 in the near term for USDCAD. Proposed support is 1.2580/90. BoC is Wednesday.
USDTRY DAILY
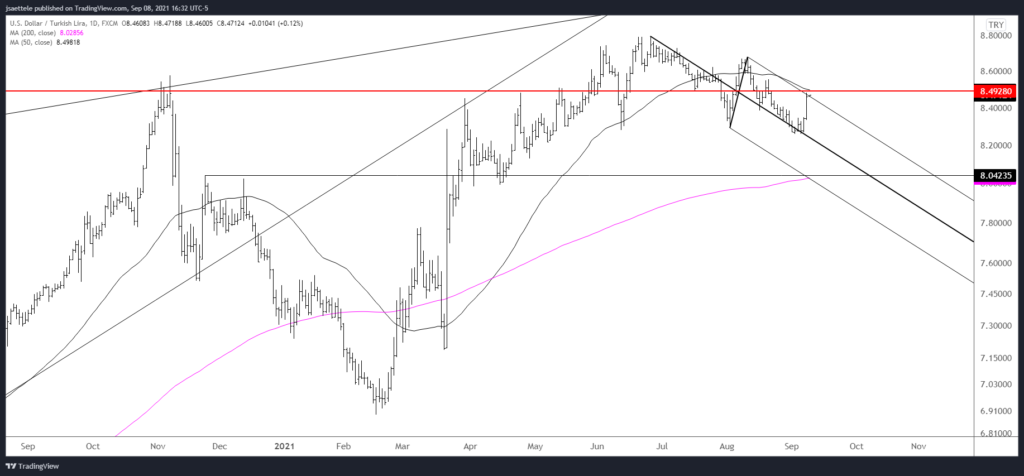
IF a massive double top is forming since last November and IF a rounding top of sorts is forming since March THEN USDTRY should turn down near the current level, which is defined by the 50 day average, the upper parallel from a short term fork, and former highs/lows. A 4 hour key reversal would be enough for me to put on a short…stay tuned.
