Market Update 9/9 – Turkish Lira Setup
USDOLLAR 4 HOUR
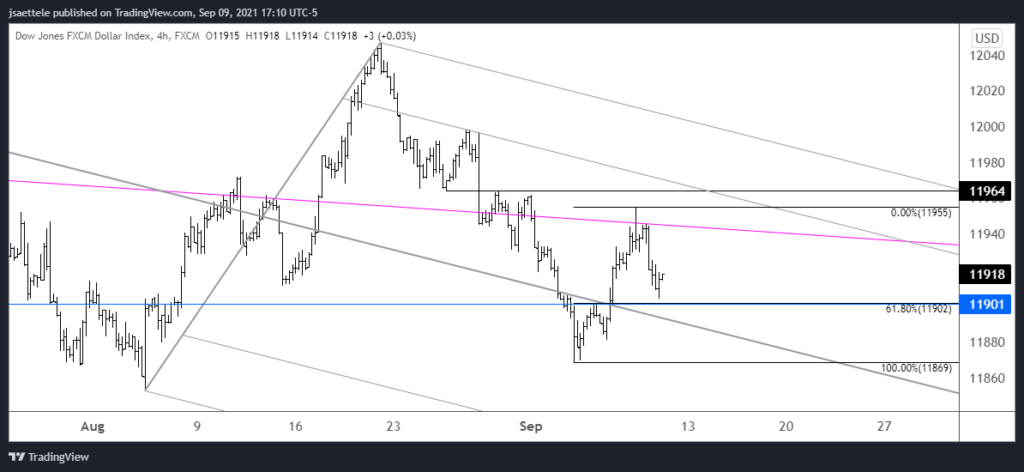
USDOLLAR has pulled back and responded to 11900 (roughly…61.8% retrace of the rally is 11902). The rally appears impulsive so expectations are for additional strength following this pullback to ‘ideal’ support. In other words…USD bullish.
EURUSD HOURLY
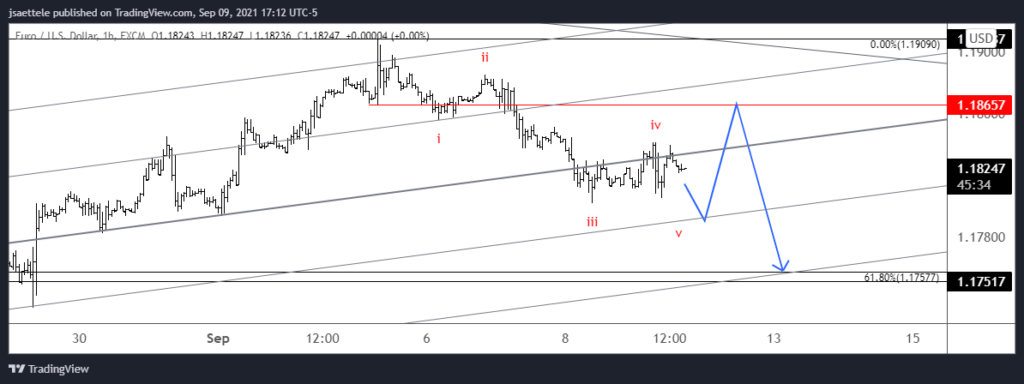
A bit more weakness in EURUSD would make the drop from last week’s high in 5 waves. Watch for 1.1790 or so support. Following the completion of 5 waves down, a corrective bounce is should take place towards 1.1865. As noted yesterday, I prefer shorting strength.
9/8 – ECB is Thursday. I don’t make trading decisions based on my ‘fundamental’ analysis but I do like to know when important news events are going to be released. Not much has changed regarding the near term technical picture for EURUSD. Pay attention to parallels within the near term EURUSD bullish fork. 1.1780s and 1.1870s are proposed support and resistance. I favor shorting strength into the latter level and targeting 1.1750s (61.8% retrace).
USDTRY DAILY
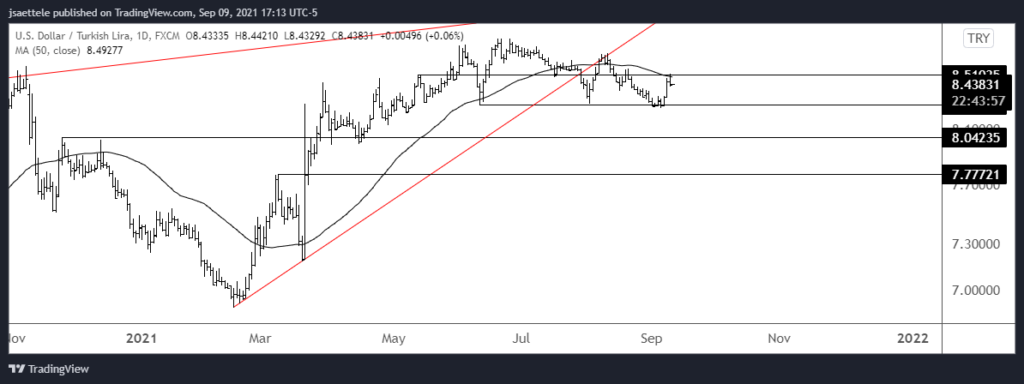
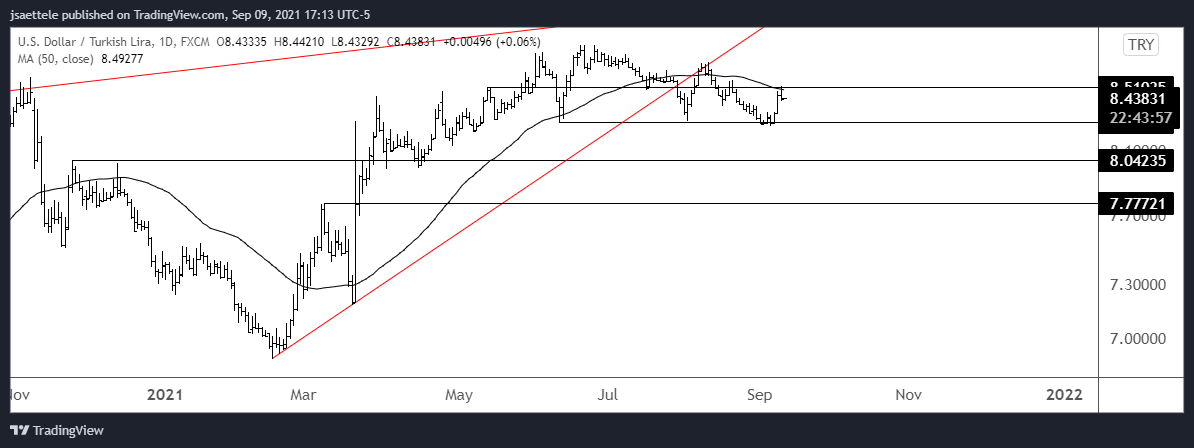
USDTRY put in a key reversal from noted resistance. The combination of technical levels and pattern (possible rounding top) makes for an amazing setup. I am bearish against today’s high.
9/8 – IF a massive double top is forming since last November and IF a rounding top of sorts is forming since March THEN USDTRY should turn down near the current level, which is defined by the 50 day average, the upper parallel from a short term fork, and former highs/lows. A 4 hour key reversal would be enough for me to put on a short…stay tuned.
AUDJPY DAILY
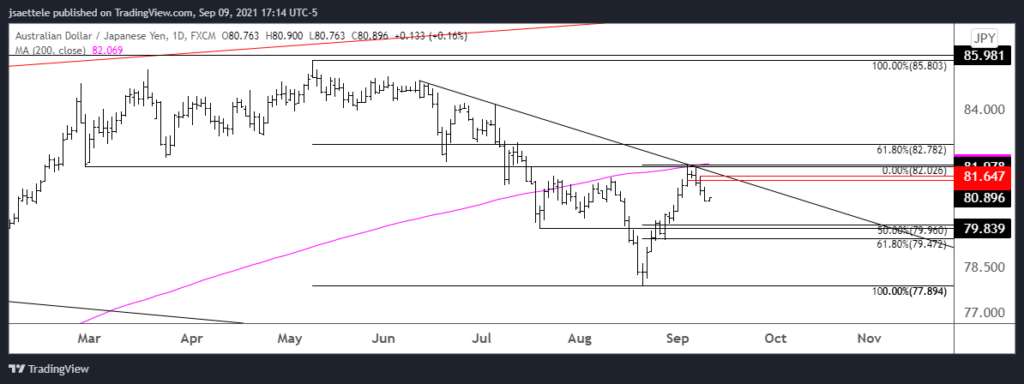
AUDJPY has rolled over from the key technical level noted yesterday. Near term downside focus is 79.50-71.00 (50%-61.8% retrace) although it’s possible that a much more important topping process will lead to deeper losses. I like shorting into 81.60/90. Risk is tight on the short side and that’s all that we can control.
9/6 – AUDJPY has traded into a big level (ahead of RBA mind you) too. The level in question is defined by the 2/26 low and 200 day average. I’m looking for at least a pullback and will keep an eye on the 200 period average on the 4 hour chart for support. This average tends to serve as a useful pivot (see below).

