Market Update 6/10 – USDJPY about to Break Down?
BTCUSD HOURLY
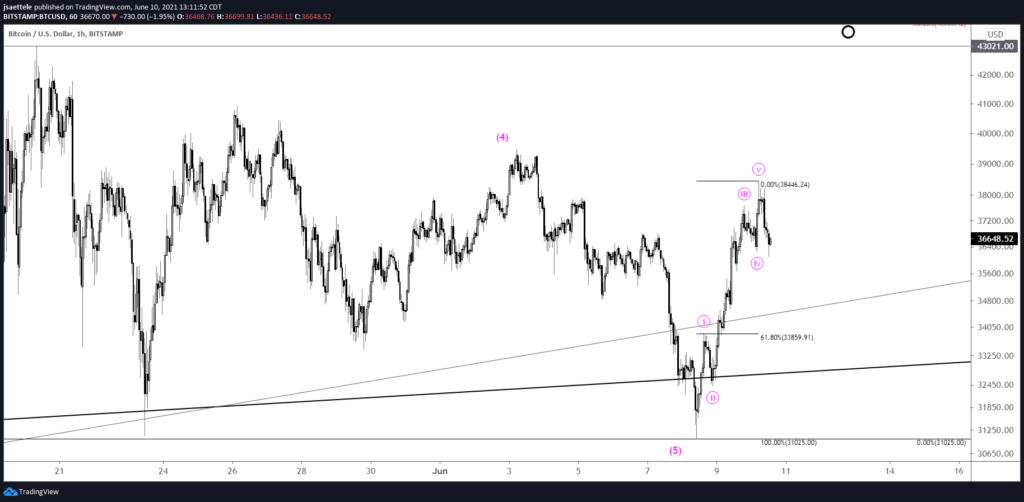
BTCUSD is following the script. The rally from this week’s low is in 5 waves which suggests a small pullback before another leg up. Proposed support is 33860. 42000-44000 remains proposed resistance.
6/9 – BTCUSD is about the only thing that moved today so let’s start there! It appears that 5 waves down are complete from the April high. The implication is for a corrective recovery before additional downside (still thinking 20000 or so). 42000-44000 is a well-defined zone for resistance. In fact, BTCUSD has a history of retracing 38.2% of a sharp drop before resuming lower (see below). The below chart also illustrates the usefulness of the 200 day average.
COPPER DAILY
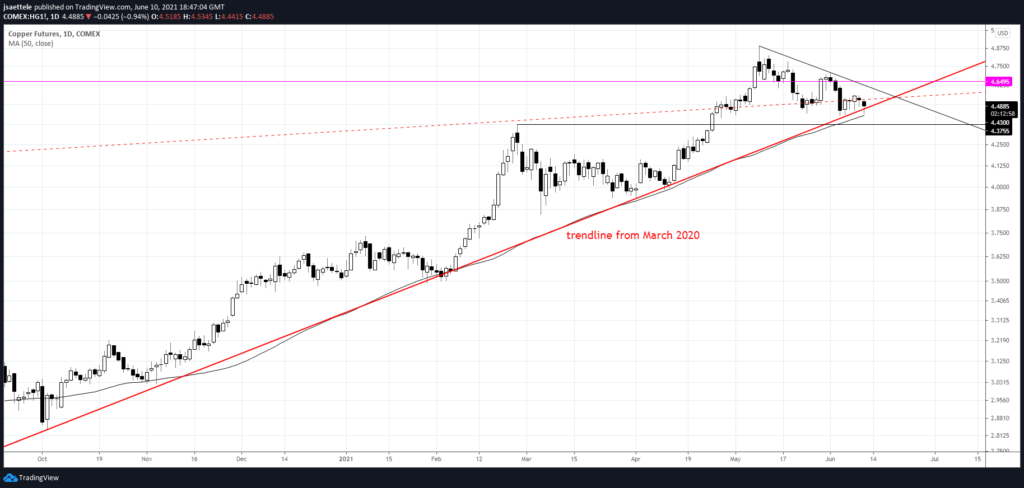
Here we are again in copper! 14+ month trendline support and the 50 day average are being put to the test. A break could lead to extended weakness. More importantly, a break would indicate a significant behavior change. Maybe that is what’s needed in order for markets to ‘wake up’ generally?
6/7 – Copper is at 14+ month trendline support. A break below would indicate a significant behavior change and usher in the largest decline since the rally started in March 2020. The long term picture is below.
AUDUSD 4 HOUR
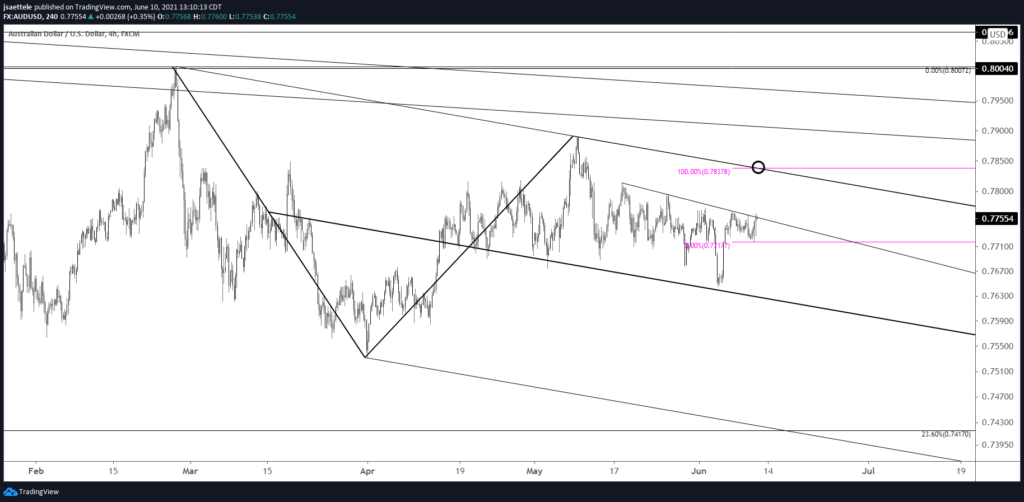
The extremely tight range in AUDUSD persists. In fact, this week’s range is 0.62% so far! We still have Friday but if this range remains then this would be the smallest AUDUSD weekly range since 1998! My best guess in this chop is that AUDUSD trades up to .7838 then reassess. This is 2 equal legs up from last week’s low and the line off of the February and May highs.
USDJPY 4 HOUR
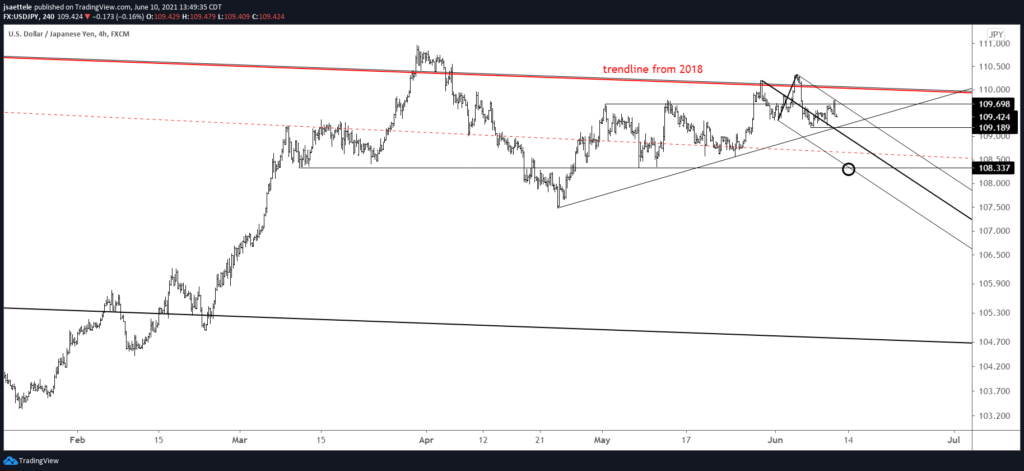
109.20 is the breakdown level in USDJPY now but there is a well-defined bearish fork in place and today’s high at 109.80 is at a well-defined horizontal level. As such, I’m bearish against today’s high and looking towards 108.34 initially.
6/8 – Absolutely no change regarding USDJPY comments other than noting that proposed resistance is barely higher at the 61.8% retrace of the drop. That level is 109.89. The breakdown level is about 109.10.
USDTRY 4 HOUR
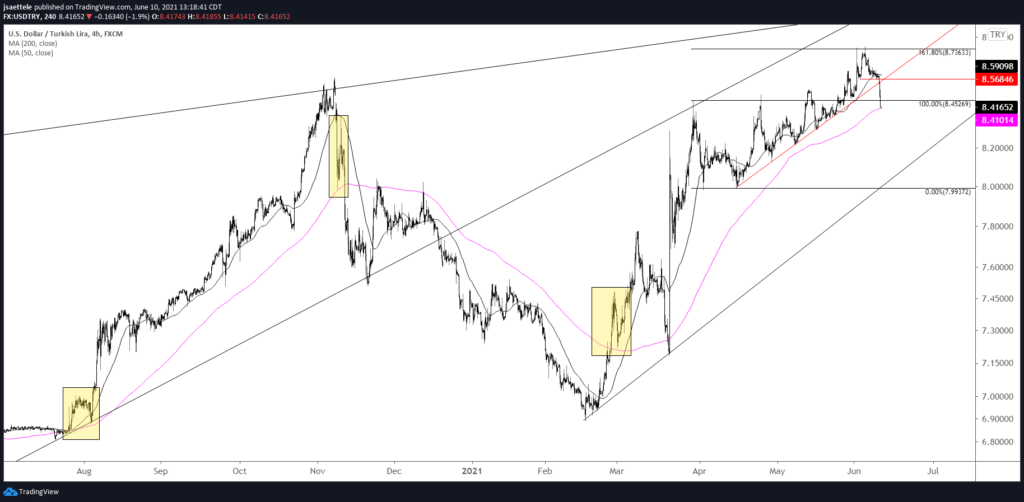
USDTRY dumped today after breaking a short term trendline. Price is testing the 200 period average on the 4 hour chart. After the November top, price tested this average before trading back to the 50 period average and then resuming lower. Something similar here? If that happens now, then resistance should be near 8.5680. Another entry option is for price to break below the 200 period average and then for that average to provide resistance. The opposite happened (price broke above the average and the average was then support) last August and in March.
EURJPY HOURLY
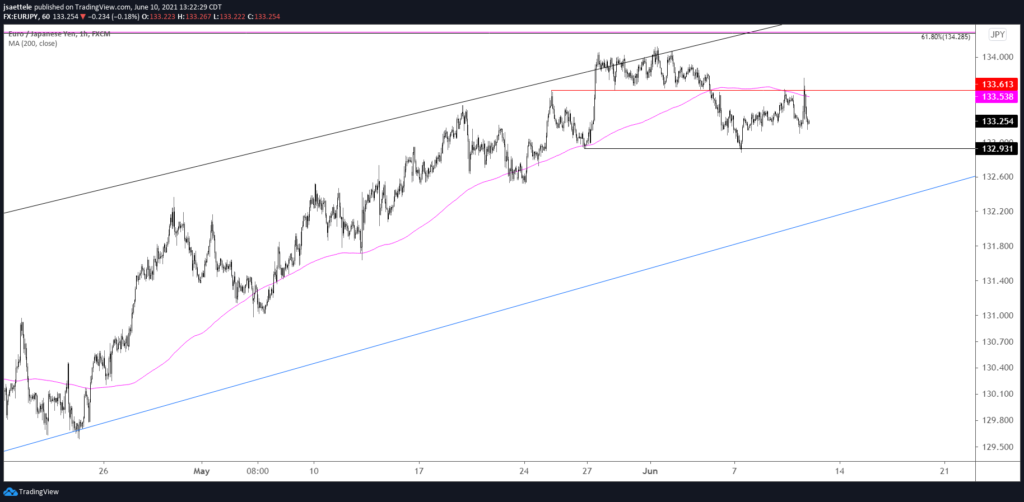
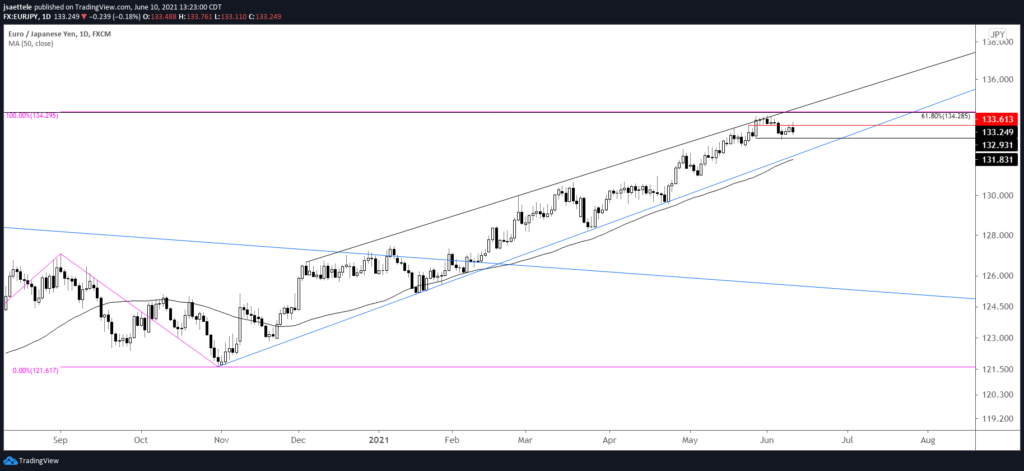
133.600 did provide resistance so I’m looking lower in EURJPY until the trendline from the October low, which is about 132.00 and in line with the 50 day average (see below). A break below 132.90 would also set a head and shoulders objective at 131.74. So general focus is on 131.70-132.00.
6/7 – EURJPY has turned down just ahead of the noted 134.30. The lower wedge line is about 132.00 but 133.60 should provide resistance if a top is in place. This level is defined by the 200 hour average and a well-defined horizontal pivot (see below).
EURJPY DAILY
NZDJPY 4 HOUR
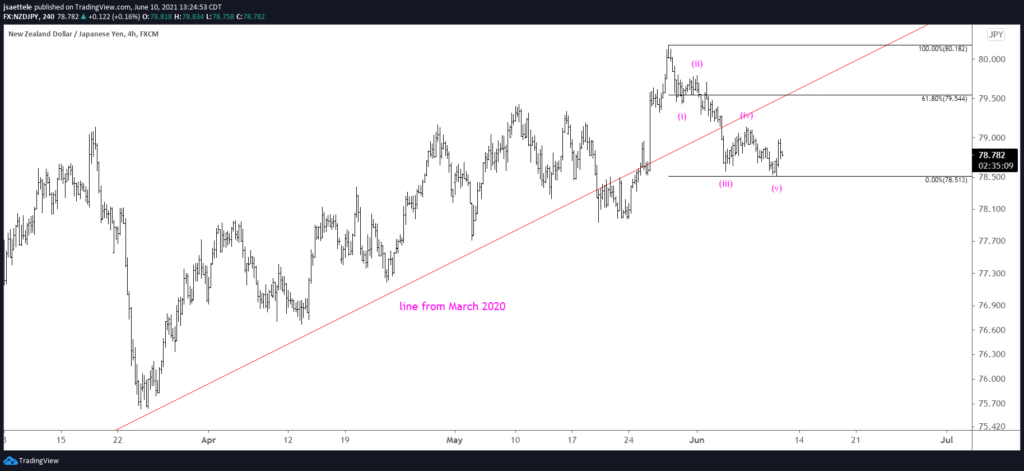
NZDJPY weakness from the May high is in 5 waves. The implication is for a corrective bounce before additional weakness. 79.50s is ideal resistance. This is the 61.8% retrace and the underside of the trendline from the March 2020 (red line). Downside focus is the lower parallel from the Schiff fork that originates at the 2020 low, which is line with the April low at 76.66 (see below).


