Market Update 6/9 – Extreme Complacency
BTCUSD DAILY
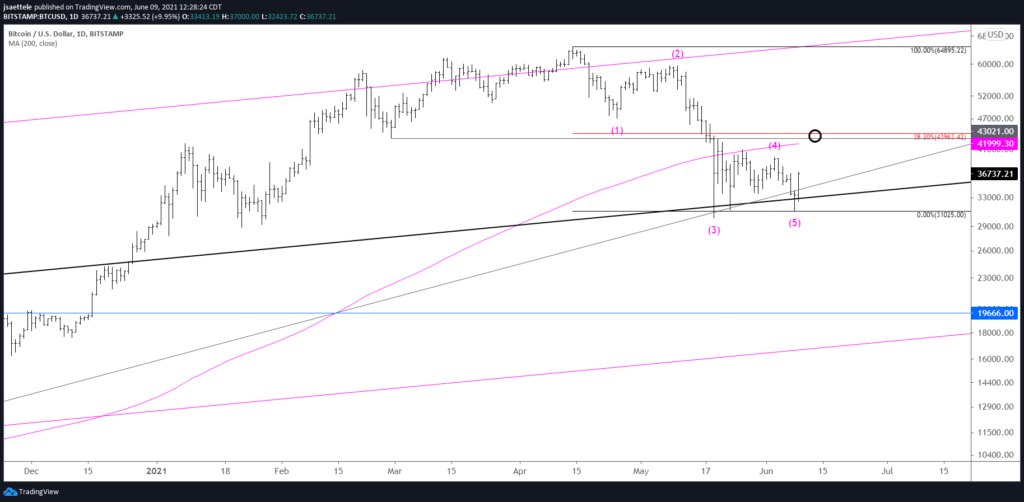
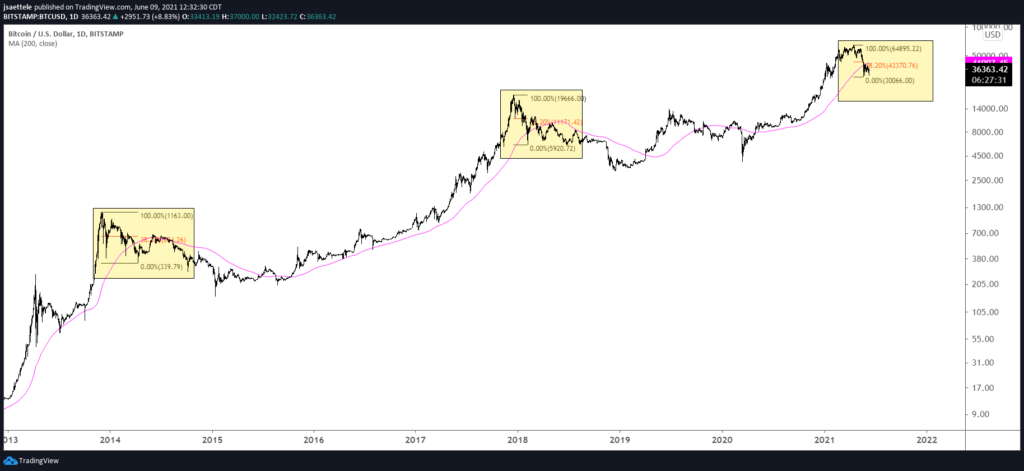
BTCUSD is about the only thing that moved today so let’s start there! It appears that 5 waves down are complete from the April high. The implication is for a corrective recovery before additional downside (still thinking 20000 or so). 42000-44000 is a well-defined zone for resistance. In fact, BTCUSD has a history of retracing 38.2% of a sharp drop before resuming lower (see below). The below chart also illustrates the usefulness of the 200 day average.
6/2 – BTCUSD may have completed a 4th wave triangle within a 5 wave decline from the April high. The decline channels in perfect Elliott form and proposed wave 4 has traced out a well-defined triangle. If the proposed interpretation is correct, then BTCUSD is lower from the current level (this pattern negates above 40904).
BTCUSD DAILY
GBPUSD DAILY
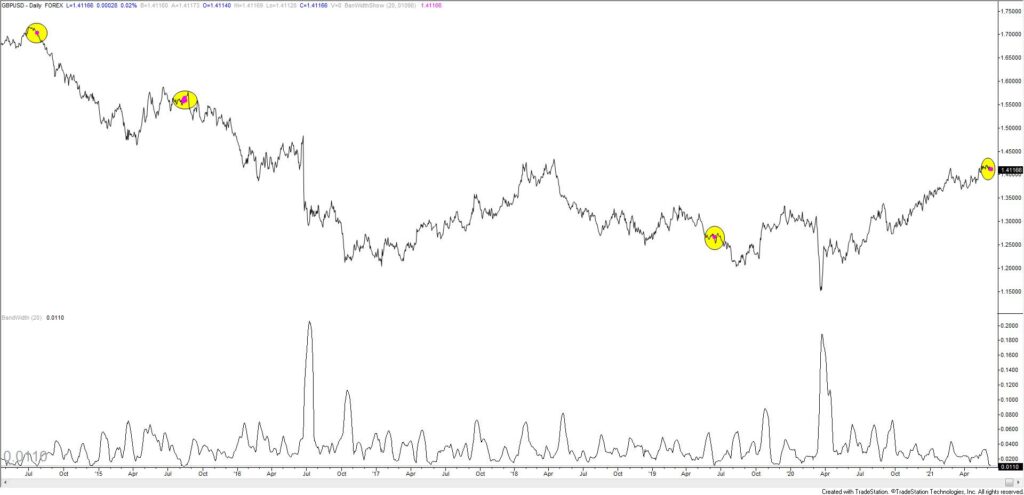
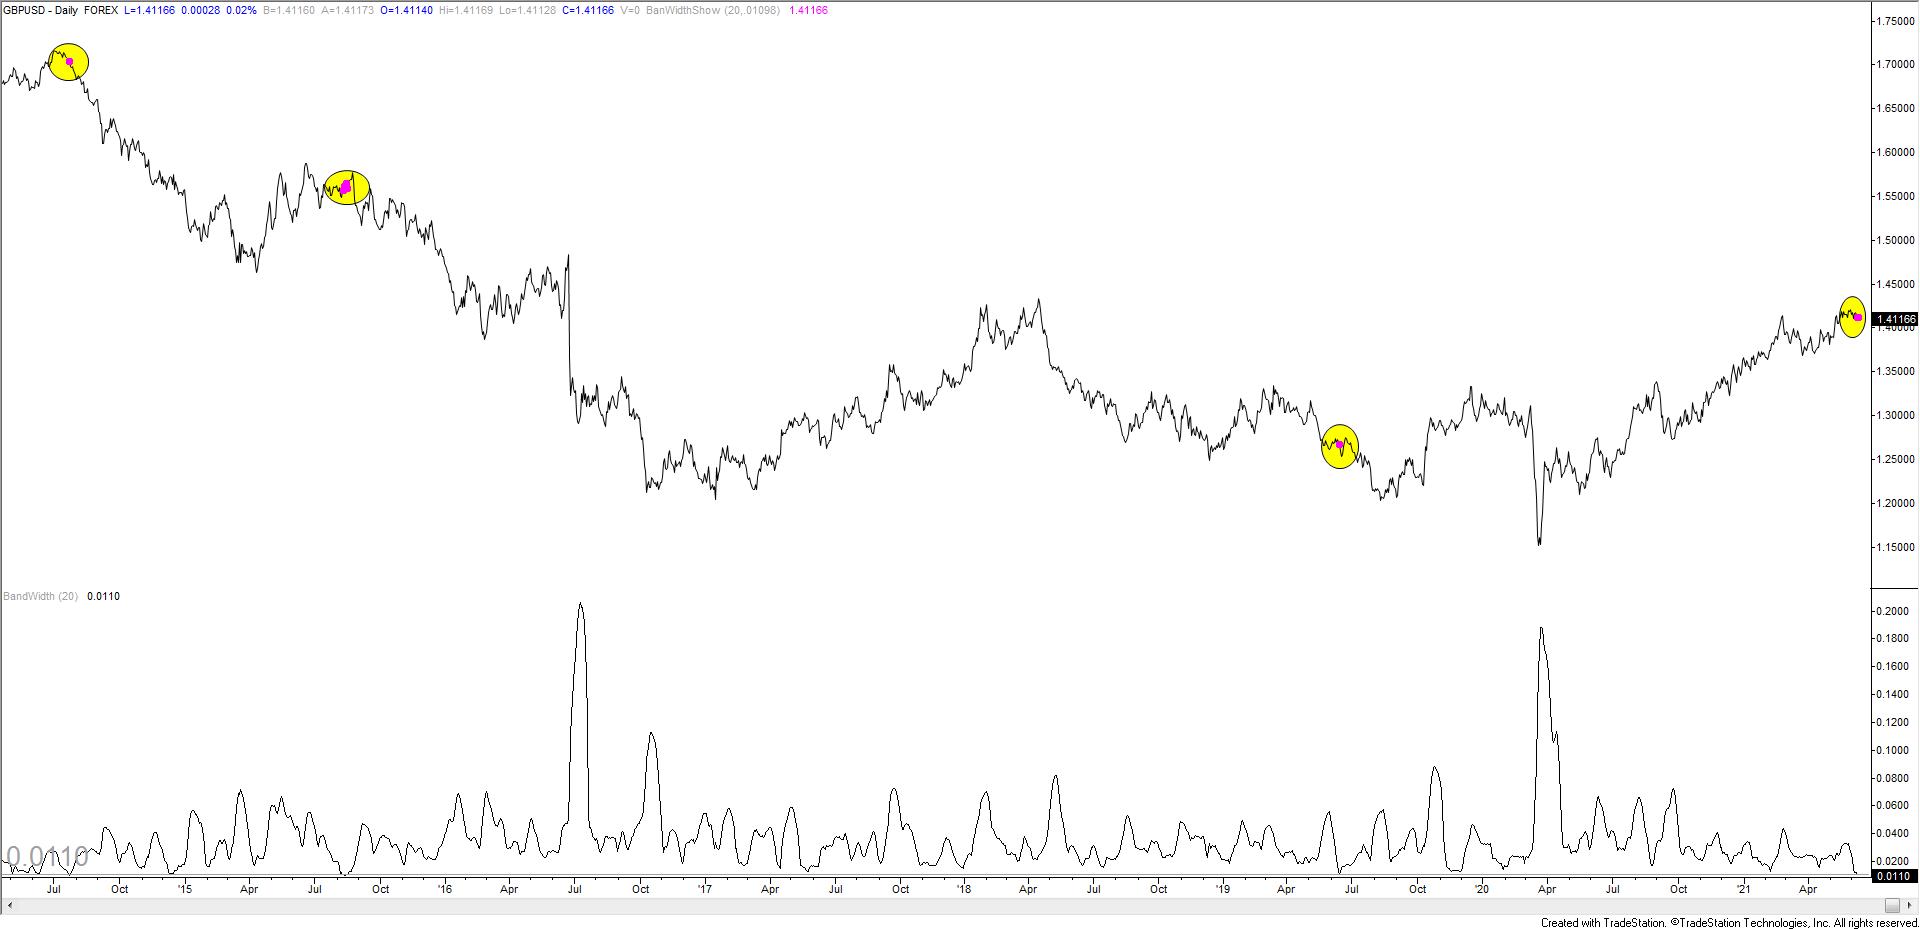
Daily Bollinger Band width for GBPUSD is extremely low. The reading is towards the lower end of its historical range. Readings this low are shown with magenta dots. Although BB width is not a directional indicator, extremely low readings have occurred before sharp declines. This makes sense since extreme complacency (as indicated by narrow Bollinger Bands) occurs at USD lows.
6/8 – It was awfully quiet in G7 FX today. The EURUSD range was .24%. That’s the lowest since 2/15, when the daily range was .23%. Prior to that,the lowest range was .20% on 2/17/20…right before COVID dominated the narrative for a time. Even so, don’t forget about the GBPUSD volume reversal on 6/1. That’s still the high. Near term, the channel is now about 1.4050. I’m targeting there for now.
AUDJPY DAILY
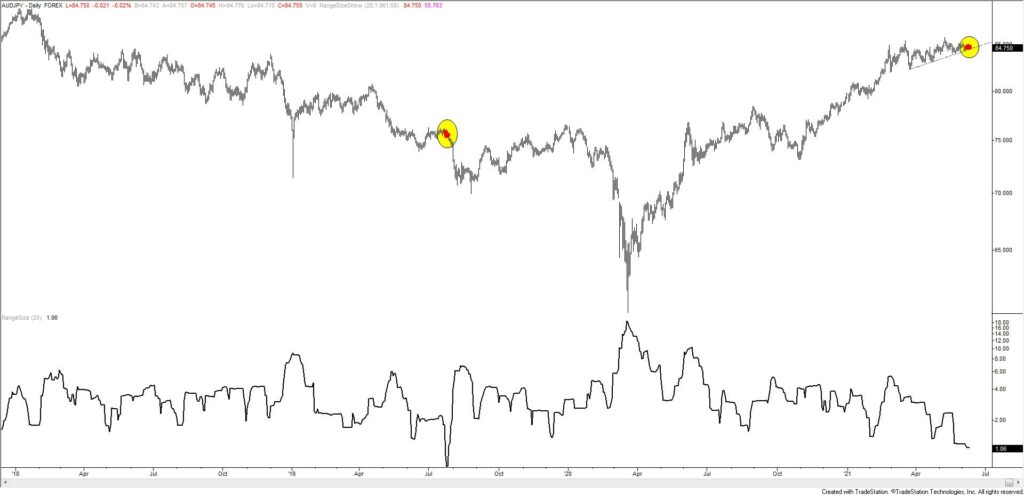
The indicator below AUDJPY is 20 day range size (percentage). The 20 day range has only been this small once…EVER. That reading was in July 2019…right before the bottom fell out of the cross. Complacency is EXTREME! The short trigger is the trendline from the 3/24 low….which is about 84.50.

