Market Update – May 14
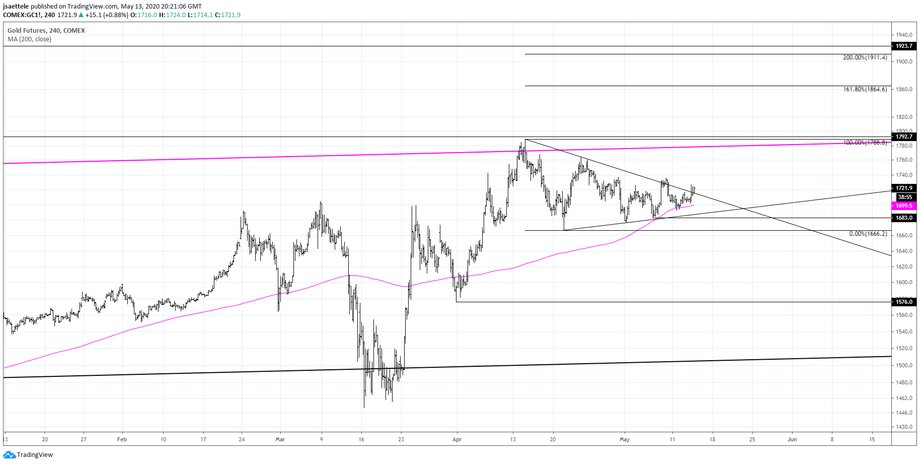
GOLD FUTURES (GC) 4 HOUR
I like to say ‘resistance is resistance until it’s broken’. Gold has been consolidating in a triangle since the April high and is testing the triangle resistance. Triangles tend to resolve in the direction of the previous trend…in this case higher (triangles can occur at highs as consolidation tops…the key is to wait for the break). At the current juncture, I lean bullish. The triangle objective is 1911, which is just under the all-time high of 1923.70. Spot gold (see below) is just under its triangle resistance line and the equivalent objective is 1834.
5/10 – Since reaching the long term parallel (magenta line) on 4/13, gold has traded sideways. Price rolled over last week from short term trendline resistance so be aware of the lower boundary near 1683. A break below there would leave price action since 4/13 as a consolidation top. Immediate downside focus would then be the 3/31 low at 1576.
SPOT GOLD (XAUUSD) 4 HOUR

QQQ DAILY

The turn lower in QQQ occurred from the long term upper parallel of the structure from the 2002 low (see weekly chart below). A major downside level to be aware of is 204. This is the 38.2% retrace of the rally from the March low, 4/21 low, and parallel that extends off of highs in 2018 and 2019. The 50 and 200 day averages are just below this level currently. Watch for resistance at 223.25/75.
QQQ WEEKLY

USDJPY 4 HOUR

USDJPY has pulled back to proposed support…so I want to be a buyer but one more flush into 106.60s (61.8% retrace and 5/7 high) is possible. Also, the week open is 106.54. Stay tuned but bottom line here is that I’m constructive USDJPY at these levels.
5/11 – USDJPY broke out of a wedge today. As is often the case with wedge breaks, the move after the break accelerated. Highs from mid-April at 108.08 may provide resistance for a pullback. If that happens, then I’ll hone in on short term price action to identify support for the next leg up but a zone to keep in mind is 106.92-107.16 (April support and May month open).
EURUSD 4 HOUR

A bearish triangle may be complete in EURUSD. Price reversed sharply off the highs today on high volume. The high volume level is 1.0862 and proposed resistance is reached. Price has also been unable to break above VWAPS off of the April low and May high (see futures chart below), which I view as bearish information. Bottom line, I’m bearish below today’s high.
5/11 – EURUSD remains heavy and I’m wondering if sideways action since the March low (triangle?) results in a break lower, especially because Friday’s high was at VWAPs from the April low and May high. The line off of lows since 3/23 is the bearish trigger near 1.0770 (see daily chart below). Just be aware of the possibility.
EURO FUTURES HOURLY

NEW ZEALAND DOLLAR FUTURES HOURLY

NZDUSD has reached potential support from the April trendline and VWAP off of the March low at .5967 (spot and futures are the same price right now so these levels apply to spot). I remain bearish and await a break but recognize potential for a bounce. Watch for resistance from the high volume level (RBNZ) at .6033.
5/12 – The short term bearish fork in NZDUSD is worth following as well. .6070 (red horiztonal line) is a key level. Watch for downside acceleration on a drop below that level. Other than that, there are no new comments.
AUSTRALIAN DOLLAR FUTURES HOURLY

AUDUSD has also reached possible support from a short term trendline. Notice how VWAP from the April high was resistance in early May. That is currently .6472 and is proposed resistance along with the high volume level from today at .6479. Bottom line, I remain bearish but need to see resistance at .6472/79. The situation may be resolved with Australian employment today.
5/12 – I’m zooming in on AUDUSD action to show the short term bearish fork. Today’s low and high were exactly at the median line and upper parallel. This action increases confidence in the short setup. As the decline progresses, we should be able to identify resistance (places to increase shorts) on parallels within the fork…whether the 25 line or median line. Bottom line, I’m bearish and will follow short term action closely for additional short entries.
AUDJPY DAILY

Keep it simple and trade the range. Near term AUDJPY downside focus is 67.70. This is the 3/25 high, which was support in April and on 5/7. The 50 day average is just below.
5/12 – AUDJPY went back for another test of 70.00/20 in early U.S. trading before rolling over. The week open at 69.60 is proposed resistance now (10 minute chart below highlights setup for entry). 67.70-68.00 is initial downside focus.


