Market Update 1/12 – HUGE USD Test
SPX HOURLY

SPX has reached the proposed resistance zone. In fact, the rally from the low would consist of 2 equal legs at 4754 and today’s high is 4751. Given the longer term picture (see below), I’m on alert for weakness from the current level.
1/10 – SPX spiked below the trendline from the October low but reversed higher to close above the line. Today’s low is right at a short term bearish fork. This is instructive in that a drop below would suggest downside acceleration (median line acceleration). Watch for support near 4630. Proposed resistance is 4728/44.
SPX DAILY

ETHUSD 4 HOUR

ETHUSD held the noted 3050 level and strength from the low is impulsive. Price has reached 2022 VWAP (magenta line), which is a good spot for a pullback. Watch for support near 3212.50. Former support at 3640 is possible resistance now. This is the bottom of a large zone that extends up to 3890.
1/5 – ETHUSD has broken the line described yesterday (magenta line). This line is resistance if reached near 3640. Price is testing the 200 day average now (not shown) but the more important level is probably VWAP from the May 2021 high at 3050 (see below). Bigger picture, my view is that price drops to 985 or so in a 4th wave.
USDOLLAR DAILY

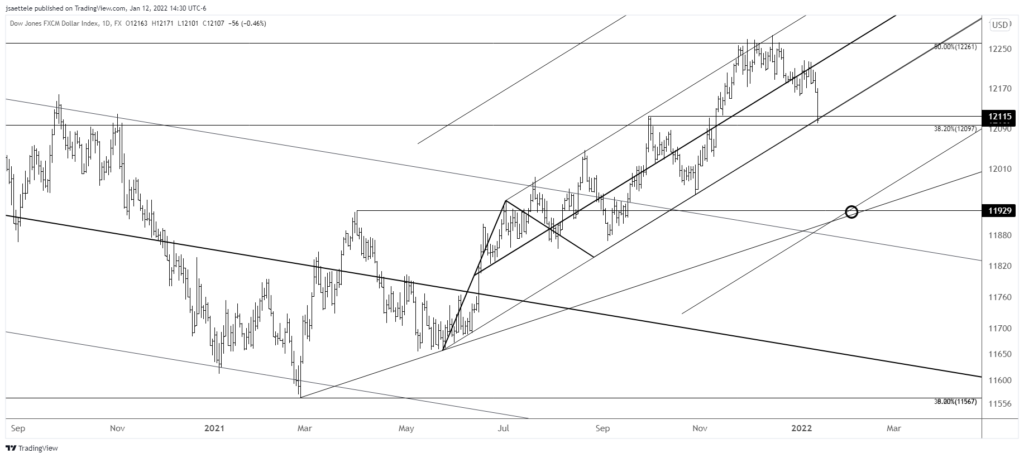
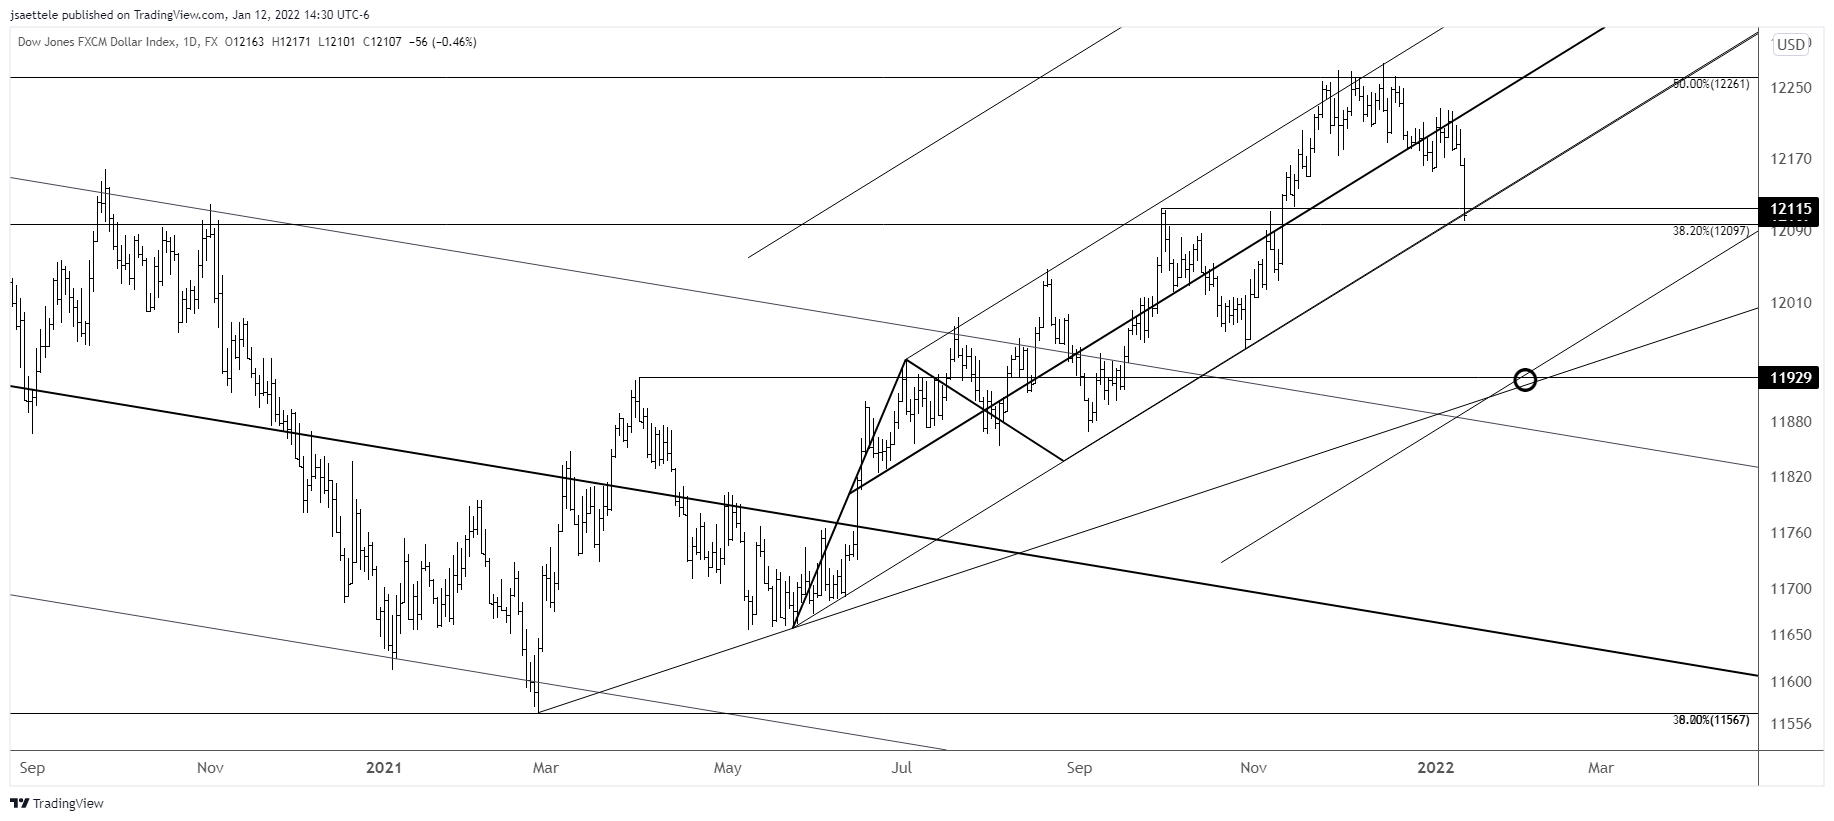
Make or break time for USDOLLAR! Price closed right at 8 month channel support. IF price breaks below the channel, then the objective is the channel extension which intersects the March-May line and March high at 11929 in early February.
1/11 – Pay attention to the USD indices over the next few days. The big level for USDOLLAR is about 12115. This is the trendline from the May low and September high. A break below would ‘announce’ that the USD trend is lower.
EURUSD 4 HOUR

EURUSD has resolved the tight December / early 2022 range to the upside. Price is knocking on the trendline from May and a break above would open up a run to 1.1660-1.1700 or so. If price pulls back now, then proposed support is 1.1380s.
1/11 – The equivalent level for EURUSD is 1.1460s. That’s the big test. RSI on the 4 hour chart is promising (see below). Notice how each price low occurs with RSI above 30. Recent lows have occurred with RSI near 40 and price has held the 200 period midpoint on the 4 hour chart so far in 2022. This is constructive evidence and gives scope to a sharp surge higher.
GBPUSD 4 HOUR

Cable broke the channel that originates from the 2021 high but price has reached VWAP from the 2021 high and the 200 day average is just above (1.3730s…see below). Price is also pressing against the parallel from the short term bullish fork. My ‘gut’ feel is that price pulls back from up here and that 1.3600 provides support for additional upside. The channel extension and swing objective from the channel break is near 1.4000.
GBPUSD DAILY

NZDUSD 4 HOUR

NZDUSD is pressing against the massive .6860 level. Simply, a break above opens up gains towards .7000 and eventually the top of the channel near .7125. If price breaks out, then .6900 may provide minor resistance for a test of .6860 as support. For context, the longer term view is below.
1/4 – Kiwi is lagging AUDUSD since the low, which is why I think Aussie is the better trade but the flat correction discussed yesterday may be complete in NZDUSD. A possible inverse head and shoulders is also evident. The pattern completes above the neckline near .6860. That’s the trigger.
NZDUSD DAILY

USDJPY DAILY

Today’s USDJPY drop cements the surge above 115.50 as a false breakout and the square root progression method described last week nailed the turn! The upper parallel from the channel off of the 2020 low (red line) is now resistance near 115.10 (also the year open). Downside focus is 112.20/50. This is the trendline from the 2021 low and the November low.
1/4 – Well, the re-test is out of the question but this USDJPY move could be a false breakout. The chart above shows square root levels. Square the year opening price and add/subtract that number in increments. For USDJPY, the square root of 11510 is 107 so the first square root up is 116.17. The idea is to look for a turn at the first square root level during the first week of the year in a market that is already extended. Several examples are below. An Elliott case is also made for a top as the rally from January 2021 consists of 2 equal legs (log scale). This chart is below. An objective trigger isn’t present yet.


