Market Update 1/11 – BIg Test for USD Soon
SPOT GOLD DAILY

Gold has ripped off of the61.8% retrace of the rally from the December low. I’m thinking that support is near 1814 (former resistance) now. Near term upside focus is 1850 or so with a break above there opening up the well-defined 1920.
1/6 – Gold support is still 1777/84! The zone is daily reversal support and the 61.8% retrace of the rally from the 12/15 (reversal day) low.
USDOLLAR DAILY

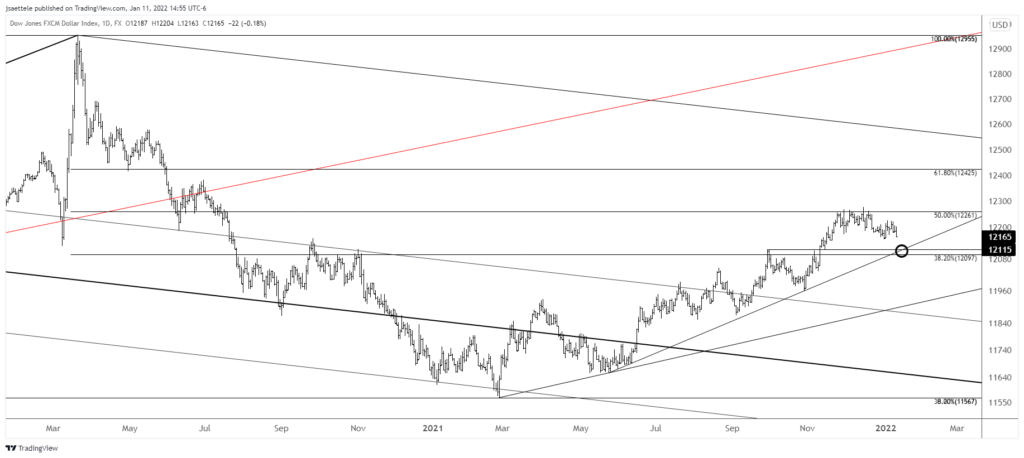
Pay attention to the USD indices over the next few days. The big level for USDOLLAR is about 12115. This is the trendline from the May low and September high. A break below would ‘announce’ that the USD trend is lower.
1/4 – USDOLLAR has churned sideways since late November. Does today’s action hint that the resolution to the chop will be lower? My reason for this thought is that today’s high is at daily reversal resistance (12/15 high) and the underside of the channel from the 2021 low. This line was support on 11/30 and 12/16. Also, don’t forget that the December high is at the 50% retrace of the decline from March 2020. A break below 12155 would suggest that the move is lower.
DXY DAILY

The big level for DXY is also the line from the May low. The lower parallel from the well-defined channel is about 95.05.
12/29 – This is the last update of 2021. A new calendar year is significant and those details will be addressed next week. The charts in this post highlight why I’m heading into 2022 with a USD bearish mindset. The chart above is a starting point insofar as making a USD bearish argument although the big picture ‘textbook’ trigger doesn’t occur until a break of the channel near 95. Until then, respect potential for strength into the 61.8% retrace of the decline from March 2020 at 97.73.
EURUSD DAILY

The equivalent level for EURUSD is 1.1460s. That’s the big test. RSI on the 4 hour chart is promising (see below). Notice how each price low occurs with RSI above 30. Recent lows have occurred with RSI near 40 and price has held the 200 period midpoint on the 4 hour chart so far in 2022. This is constructive evidence and gives scope to a sharp surge higher.
12/29 – One month ago, EURUSD bottomed at 1.1186. That price is the 61.8% retrace of the rally from 2017 (first trading day of 2017). The top side of the trendline from 2014 has also provided support. Action since the November low isn’t clear and could compose a correction before another thrust lower. If that happens then 1.1132 (close of the March low COVID week) is proposed support. That isn’t my base case however and I’m looking for upside resolution from the December range.
EURUSD 4 HOUR

AUDUSD 4 HOUR

AUDUSD is respecting a Schiff fork defined by pivots since the December low. This presents a bullish opportunity with tight risk. .7187 should provide support now (week open is .7176 as well). The upper parallel from the Schiff fork is a loose short term objective near .7320 but upside potential is significant following the hold at the November 2020 low and failed break below VWAP from the March 2020 low (see below).
AUDUSD DAILY

USDCAD 4 HOUR

I’m unhappy with how I’ve treated USDCAD so far in 2022. I came in to the year bearish but was waiting for a move back into 1.2760/90 to short. Basically, I got too cute. As it is now, USDCAD has completed a head and shoulders top so focus is lower towards 1.2450 (trendline) and possibly the October low at 1.2288. The latter level is near the measured objective from the head and shoulders. Resistance should be 1.2630/50 (high volume level and week open).
1/10 – USDCAD is clearing up a bit. Price remains confined to the range defined by VWAP from the October low and December high but 1.2760/90 is well-defined for resistance now. Also, a head and shoulders top could be in the works from the 12/3 high.


