Market Update – August 31
DXY DAILY
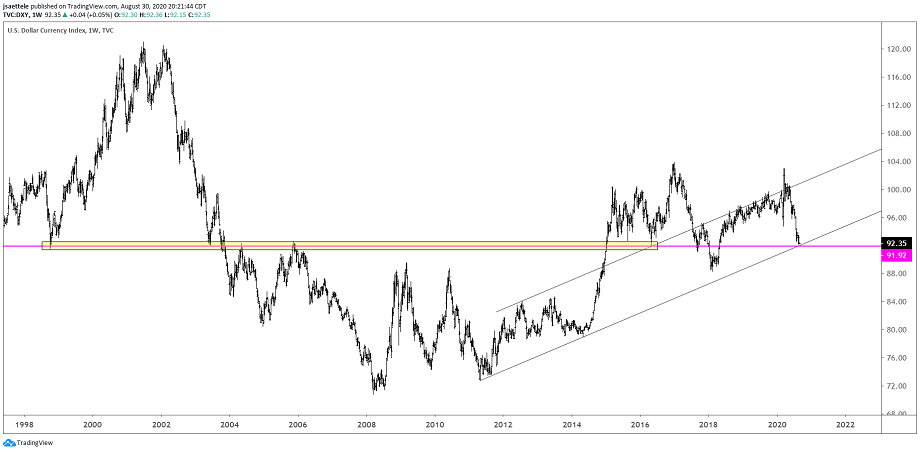
Is DXY still ‘trying’ to bottom? If so, then it needs to turn up around 92, which is the line off of the 2011 and 2014 lows (arithmetic scale). 91.50-92.00 has also been a major pivot since 1998. I sound like the boy who cried wolf but I’m on alert for a turn higher.
8/16 – DX futures made a 2 bar weekly volume reversal 2 weeks ago (inside week last week). Reversals on both sides with the same volume requirements are shown on this chart since the late 1980s. The majority of signals identified important turns.
EURUSD DAILY

EURUSD high on Friday is on the center line of the channel from the 5/14 low so a turn lower now wouldn’t surprise. My trading focus is on shorting a break under the lower parallel, currently about 1.1730. If price makes a new high, then pay attention to 1.2000/50, which is the median line of the fork from the 2015 low (not yet confirmed) and line off of the 2008 and 2014 highs.
8/25 – The USD is drifting lower ahead of Jackson Hole, which is a possible ‘sell the news’ event or maybe Powell does not address additional Japanification measures and the USD can get out of its own way. Near term EURUSD levels have not changed. 1.1880 is still proposed resistance from the 8/21 high, 61.8% retrace, and 2 legs up from the 8/21 low. The lower parallel is now about 1.1695.
CANADIAN DOLLAR FUTURES DAILY

CAD futures have reached VWAP from the 2017 high (USDCAD low). CAD highs (USDCAD lows) in 2018 and 2020 were just shy of this average so I’m on alert for evidence of a turn. For spot, strength above 1.3239 is needed in order for just a near term trend change. Absent a turn now, the next downside level to pay attention to is December 2019 low at 1.2952.
NZDUSD DAILY

NZDUSD is pressing against a major horizontal zone. Keep it simple (I should do more of that). .6750-.6800 has been a significant pivot several times since 2017 (2017 low, July 2019 high, and December 2019 high) so be aware of potential for a turn lower. Still,, the most recent high volume level is .6629. As long as price is above there, I’m not fighting this move.
LUMBER WEEKLY

Lumber has gone parabolic. No other way to put it. Weekly RSI registered its highest level ever last week…just above the March March 1993 reading, which was the week before a 55% drop over 16 weeks. On August 21st, daily RSI reached 92.35. There has only been one higher daily RSI print…2/22/1993. That was 2 weeks before the top and mentioned 55% decline (see next 2 daily charts). Price is also testing the underside of the trendline from the 2009 low. The extreme RSIs are reason enough for me to think mean reversion is due. The last chart shows lumber, AUDUSD, and S&P futures for 2020. Not much of a difference! My point is that the extreme weekly and daily RSI readings on lumber could also warn of a high in other markets against the USD.
LUMBER DAILY

LUMBER (BLACK), AUDUSD (BLUE), SPX (RED) HOURLY


